


Australian Dollar vs Japanese Yen Technical Analysis
- AUD/JPY declines to its lowest level in over a decade
- Will bears continue controlling the price action?
- Bearish Market
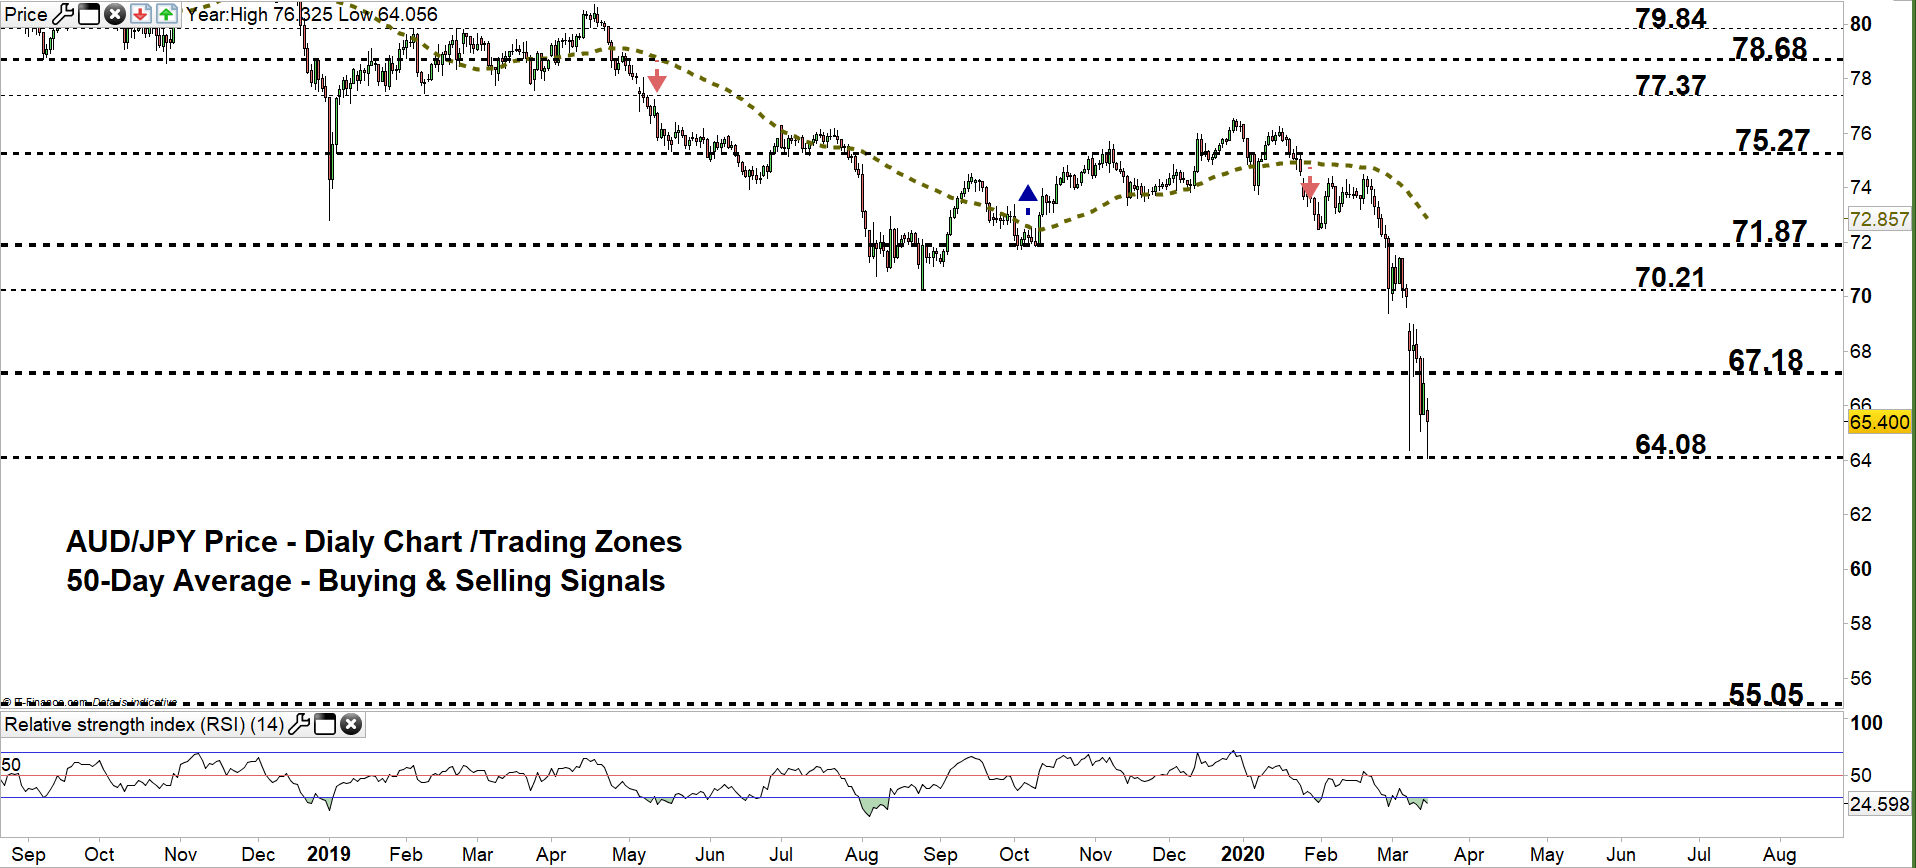
On March 9, Aussie Dollar tumbled against Japanese Yen to 64.35 -its lowest level in nearly eleven years. The price rallied after as some bears seemed to cover. Yet, the market closed on Friday in the red with 4.5% loss.
Alongside that, the Relative Strength Index (RSI) dipped below 70 and remained in oversold territory emphasizing the strength of downtrend move.
AUD/JPY DAILY PRICE CHART ( Oct 11, 2018 – Mar 16, 2020) Zoomed Out

AUD/JPY DAILY PRICE CHART (NOv 1 – Mar 16, 2020) Zoomed IN
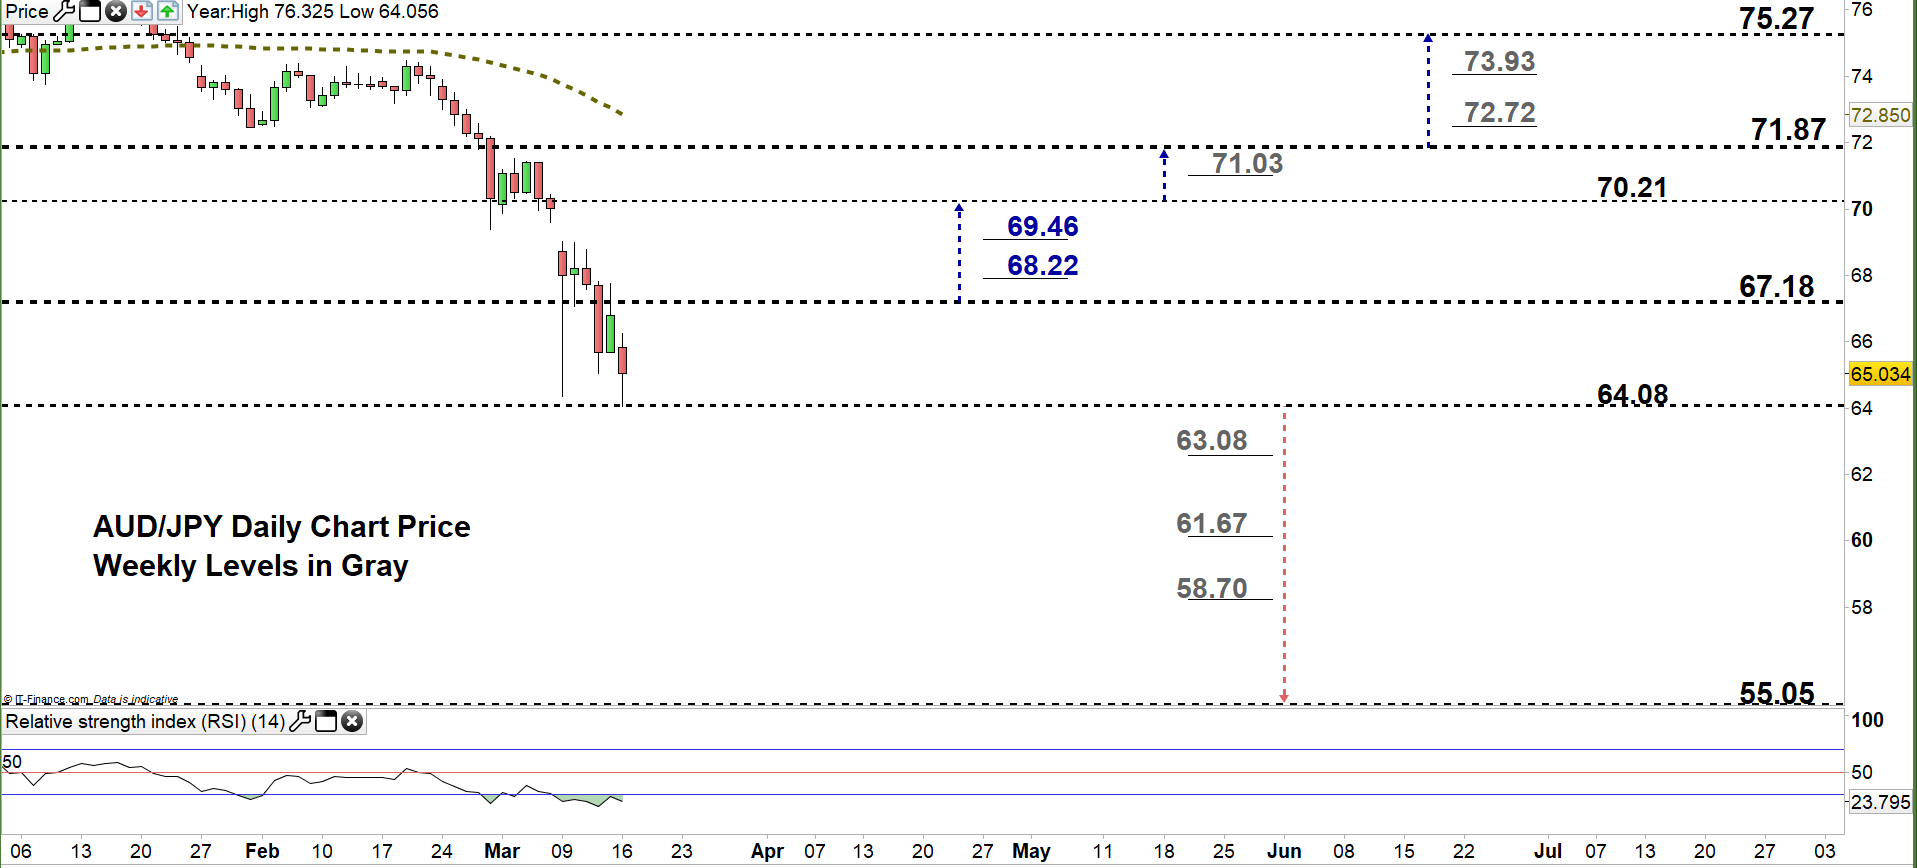
Looking at the daily chart, we noticed that at the start of last week AUD/JPY opened with a gap to the downside. Later on, the pair declined to the current trading zone 64.08- 67.18. Today, the price rebounded from the low end of it.
Thus, the market could be on its way for a test of the high end of the zone. Further close above this level reflects bears hesitation. This could lead some of them to exit the market allowing AUDJPY to surge towards 70.21. Further close above this level could cause the pair to rally towards 71.87. Although, the daily and weekly resistance levels underlined on the chart (zoomed in) should be kept in focus.
In turn, any close blow the low end of the zone could mean more bearishness towards 55.05. That said, the weekly/monthly support levels printed on the chart should be considered.

AUD/JPY Four-Hour PRICE CHART (FEb 11– Mar 16, 2020)
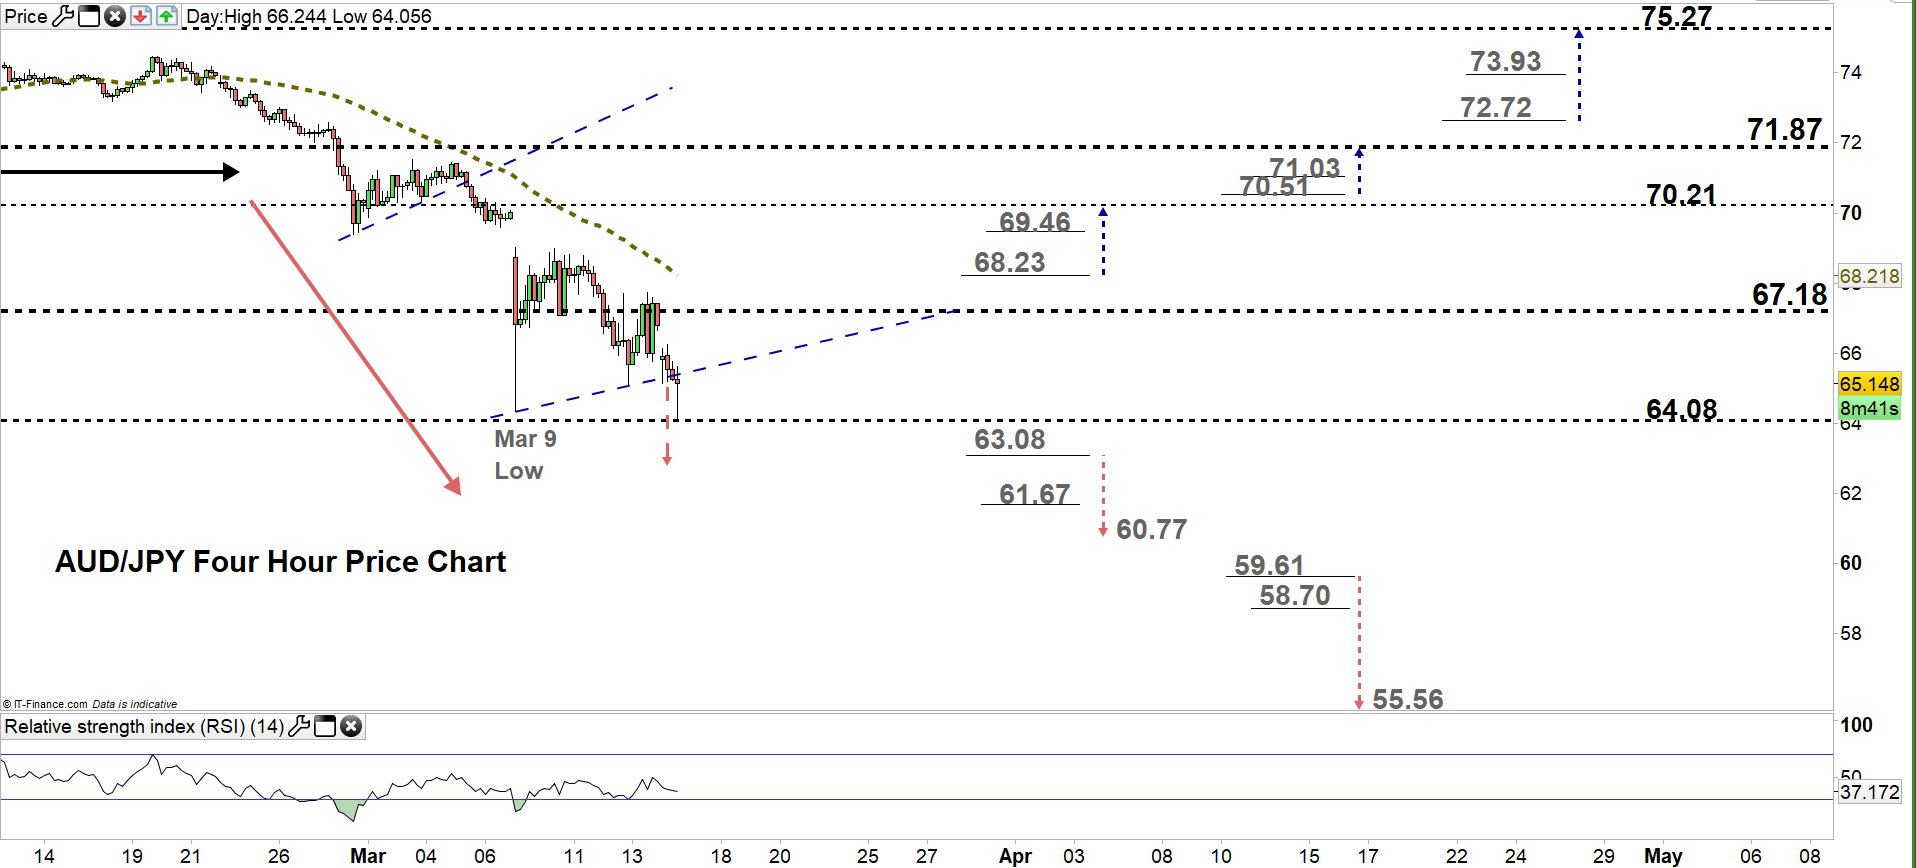
From the four- hour chart, we noticed that on March 5 AUD/JPY broke below the uptrend line originated from the Feb 28 low at 69.37 generating a bearish signal. Today, the price broke below the uptrend line originated from the March 9 low at 64.35 providing another bearish signal.
Hence, a break below 63.08 could send AUDJPY even lower towards 60.77. Nevertheless, the weekly support level marked on the chart should be watched closely. On the flip side, any break above 68.23 may cause a rally towards 70.21. Although, the daily resistance level underscored on the chart would be worth monitoring.
See the chart to find out more about key levels Cable would encounter in a further bearish /bullish scenario.

Written By: Mahmoud Alkudsi
Please feel free to contact me on Twitter: @Malkudsi


