


.jpg)

Silver Outlook, Palladium Price Chart – TALKING POINTS
- XPD/USD testing December uptrend – bearish correction ahead?
- XAG/USD downtrend could be on the verge of a bullish breakout
- Breakdown in silver prices may catalyze aggressive selling spree
PALLADIUM OUTLOOK
Palladium prices have risen almost thirty percent since the start of the December 2019 uptrend. XPD/USD’s impressive rally appears to have sputtered when the precious metal failed to clear resistance at 2499.50 (red-dotted line) and subsequently retreated to support at 2264.50 (gold-dotted line). Palladium is now approaching the same ceiling again as it tests the December uptrend (broken white line).
Traders will be closely watching for the intersection of the upward-sloping support channel and resistance at 2499.50. If XPD/USD is unable to breach this level with follow-through and breaks below the uptrend, it may inspire liquidation and open the door to a retest of support at 2264.50. Eventually, traders will have to commit to a bullish or bearish bias as the range between support and resistance narrows (purple-shaded area).
XPD/USD – Daily Chart
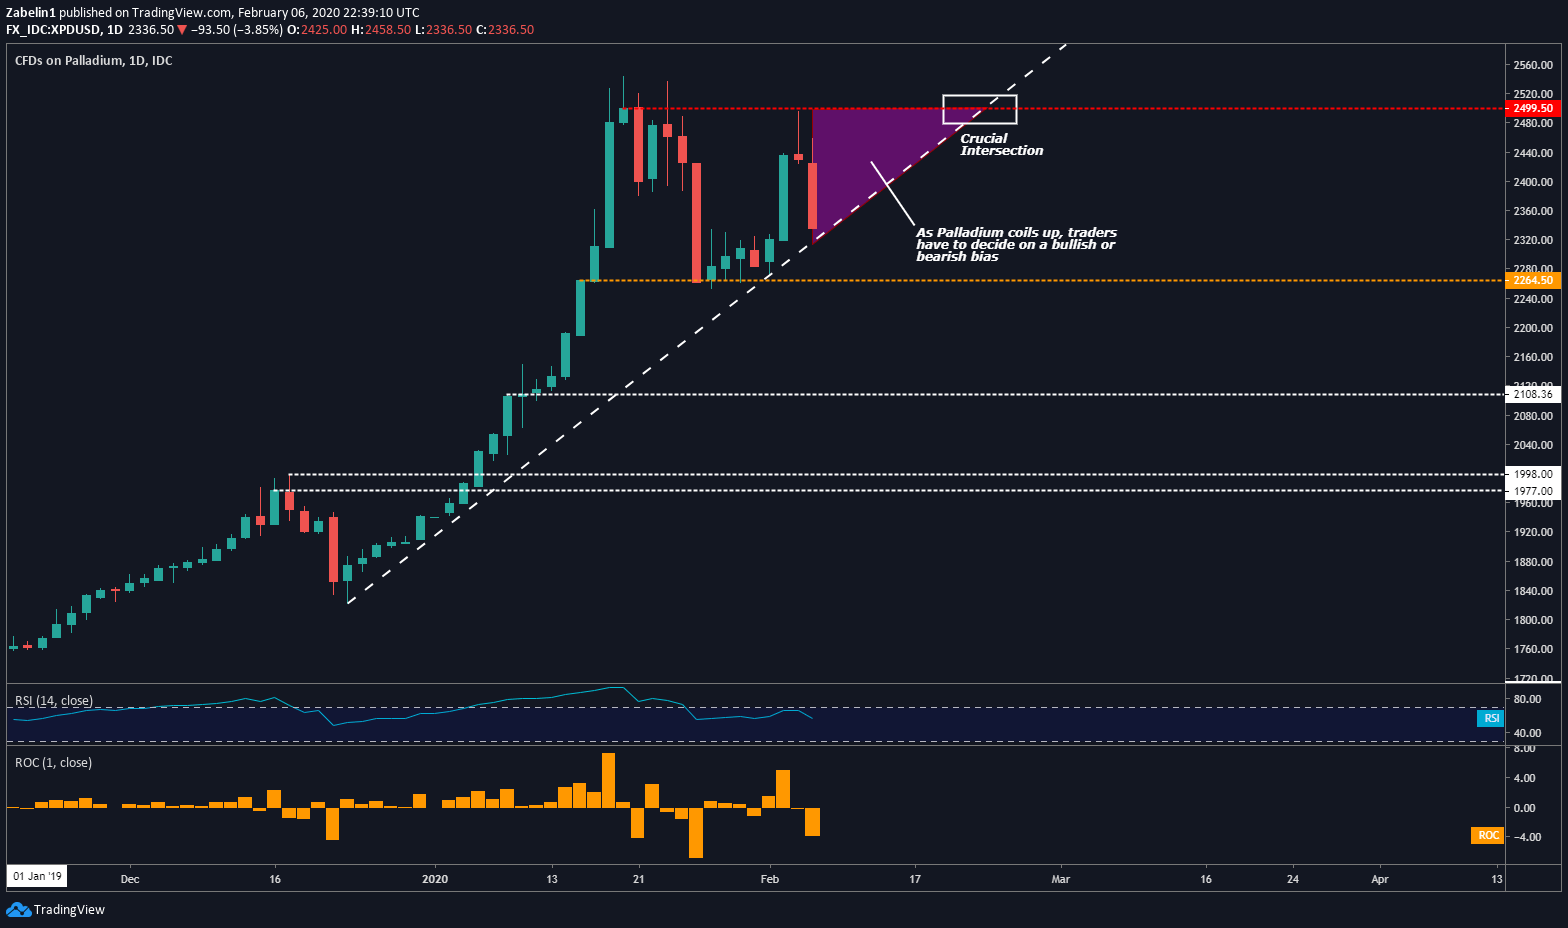
XPD/USD chart created using TradingView
SILVER PRICE CHART
After topping at 18.390 in early-January, silver prices have been on a steady decline and were guided by range-binding price parameters (white broken lines). However, XAG/USD is approaching the intersection of the upper layer with support at 17.440 with an ever-shrinking area of indecision (purple-shaded area). Much like with XPD/USD, markets will soon reveal their outlook on silver’s price trajectory.
XAG/USD – Daily Chart
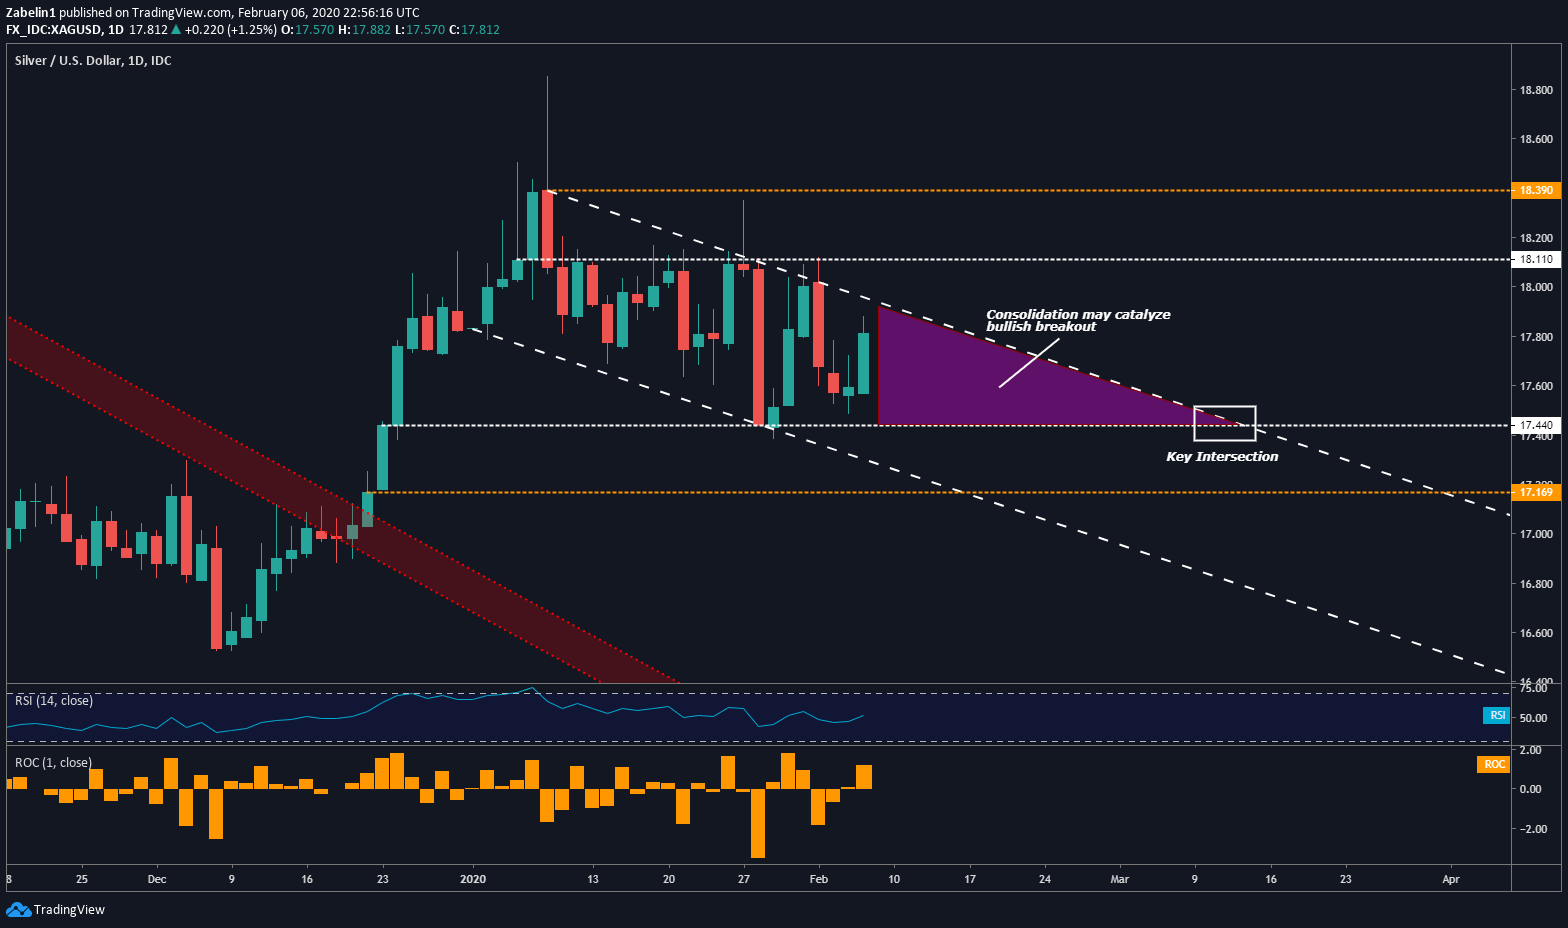
XPD/USD chart created using TradingView
If the compression catalyzes an upside breakout, bullish sentiment may be strong enough to crack resistance at 18.110. However, silver traders will then have to face the 18.390 ceiling they shied away from in January. On the other hand, if the bears win, XPD/USD may look to test support at 17.169 with risks of further losses if selling pressure overwhelms buyers.
SILVER TRADING RESOURCES
- Tune into Dimitri Zabelin’s webinar outlining geopolitical risks affecting markets in the week ahead !
- New to trading? See our free trading guides here !
- Get more trading resources by DailyFX !
--- Written by Dimitri Zabelin, Jr Currency Analyst for DailyFX.com
To contact Dimitri, use the comments section below or @ZabelinDimitri on Twitter


