


New Zealand Dollar Outlook:
- The New Zealand Dollar may slip further against the US Dollar in the longer-term, but nears oversold territory at present
- NZD/CAD trades near the 200-day simple moving average as it looks to hold above recent lows
- After failing at resistance, AUD/NZD may look to re-test support around 1.03
NZD/USD Forecast: Pair Nears the 200DMA, Teeters on Oversold Territory
The New Zealand Dollar has posted a string of daily declines versus the US Dollar as of late, as it threatens a break beneath the 200-day simple moving average. While the fundamental side is very much in flux this week with the upcoming FOMC meeting and subsequent economic data out of the United States, the technical landscape has remained relatively constant from my last New Zealand Dollar update.
NZD/USD Price Chart: Daily Time Frame (March 2018 – January 2020) (Chart 1)
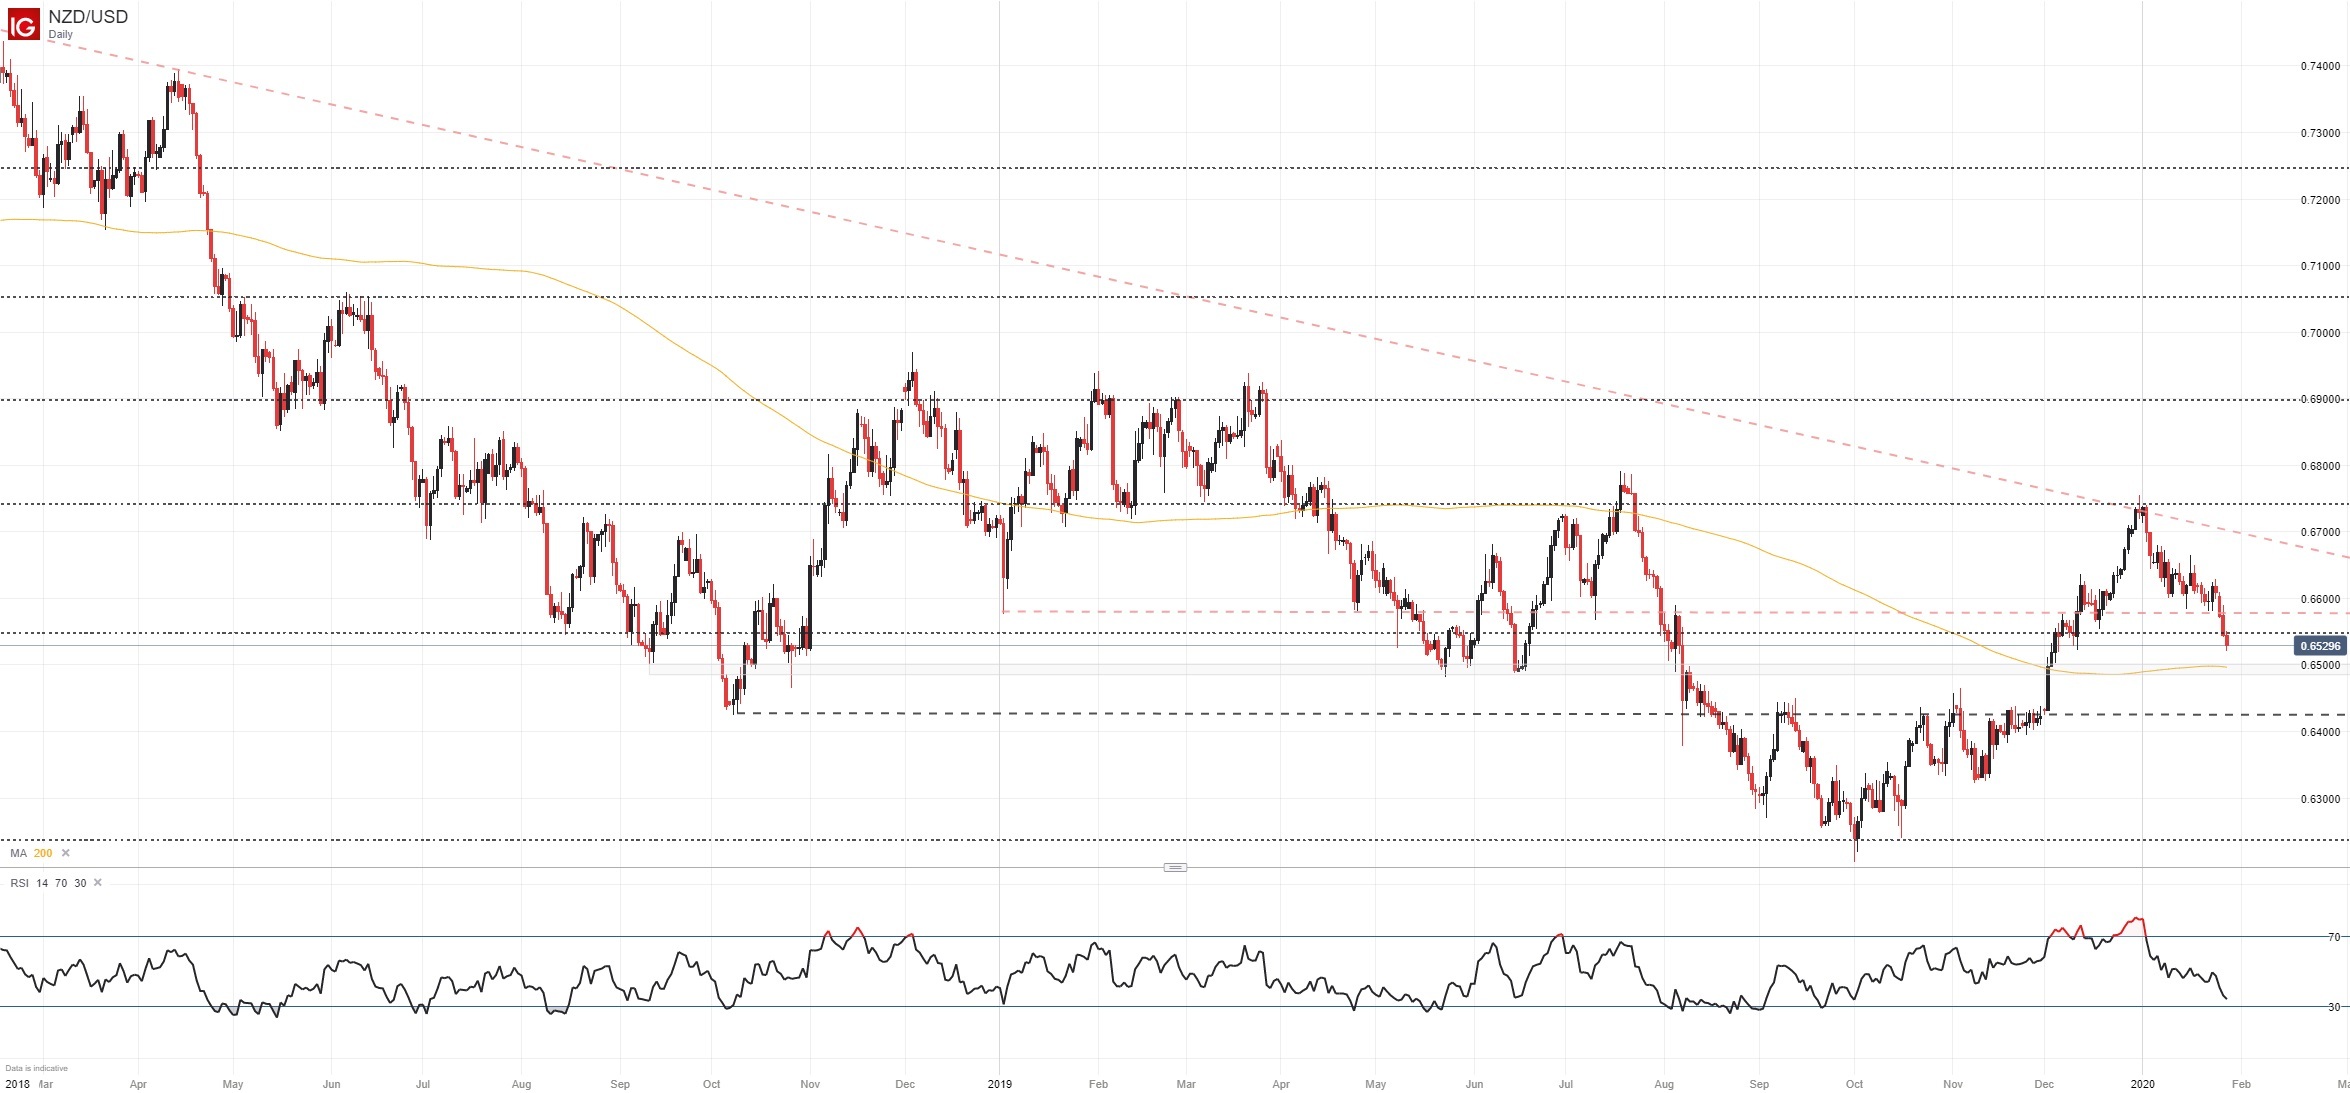
That being said, NZD/USD has deteriorated in the interim as it slips closer to the 200-day simple moving average around 0.6500. Coinciding with a few swing lows dating back to September 2018, the area could serve as a springboard for the Kiwi if fundamental themes align. Further weakness and an eventual break lower would open the door for NZD/USD to probe subsequent support near the 0.6430 zone.
Topside barriers exist at the nearby Fibonacci level and at the horizontal trendline originating from the pair’s low in January 2019. While the longer-term trend suggests NZD/USD will continue lower, the 200-day moving average and potential oversold signal from RSI could work with fundamental catalysts to create a bounce in the week ahead.
| Change in | Longs | Shorts | OI |
| Daily | 6% | -13% | 2% |
| Weekly | 40% | -35% | 15% |
Tangentially, retail trader data reveals IG Clients are split on the pair which provides a mixed trading bias. Consequently, it may be prudent to delay a position until after the Fed-related event risk has passed and more clarity is available.
NZD/CAD Forecast
NZD/CAD has displayed similar weakness but lacks the headline-grabbing event risk of the looming FOMC meeting. Instead, the pair’s next fundamental catalyst will likely be delivered in the form of Canadian GDP data due Friday. Recent statements from Bank of Canada Governor Stephen Poloz hinted the Canadian economy was weaker than expected, which could suggest disappointing GDP data and translate to CAD weakness.
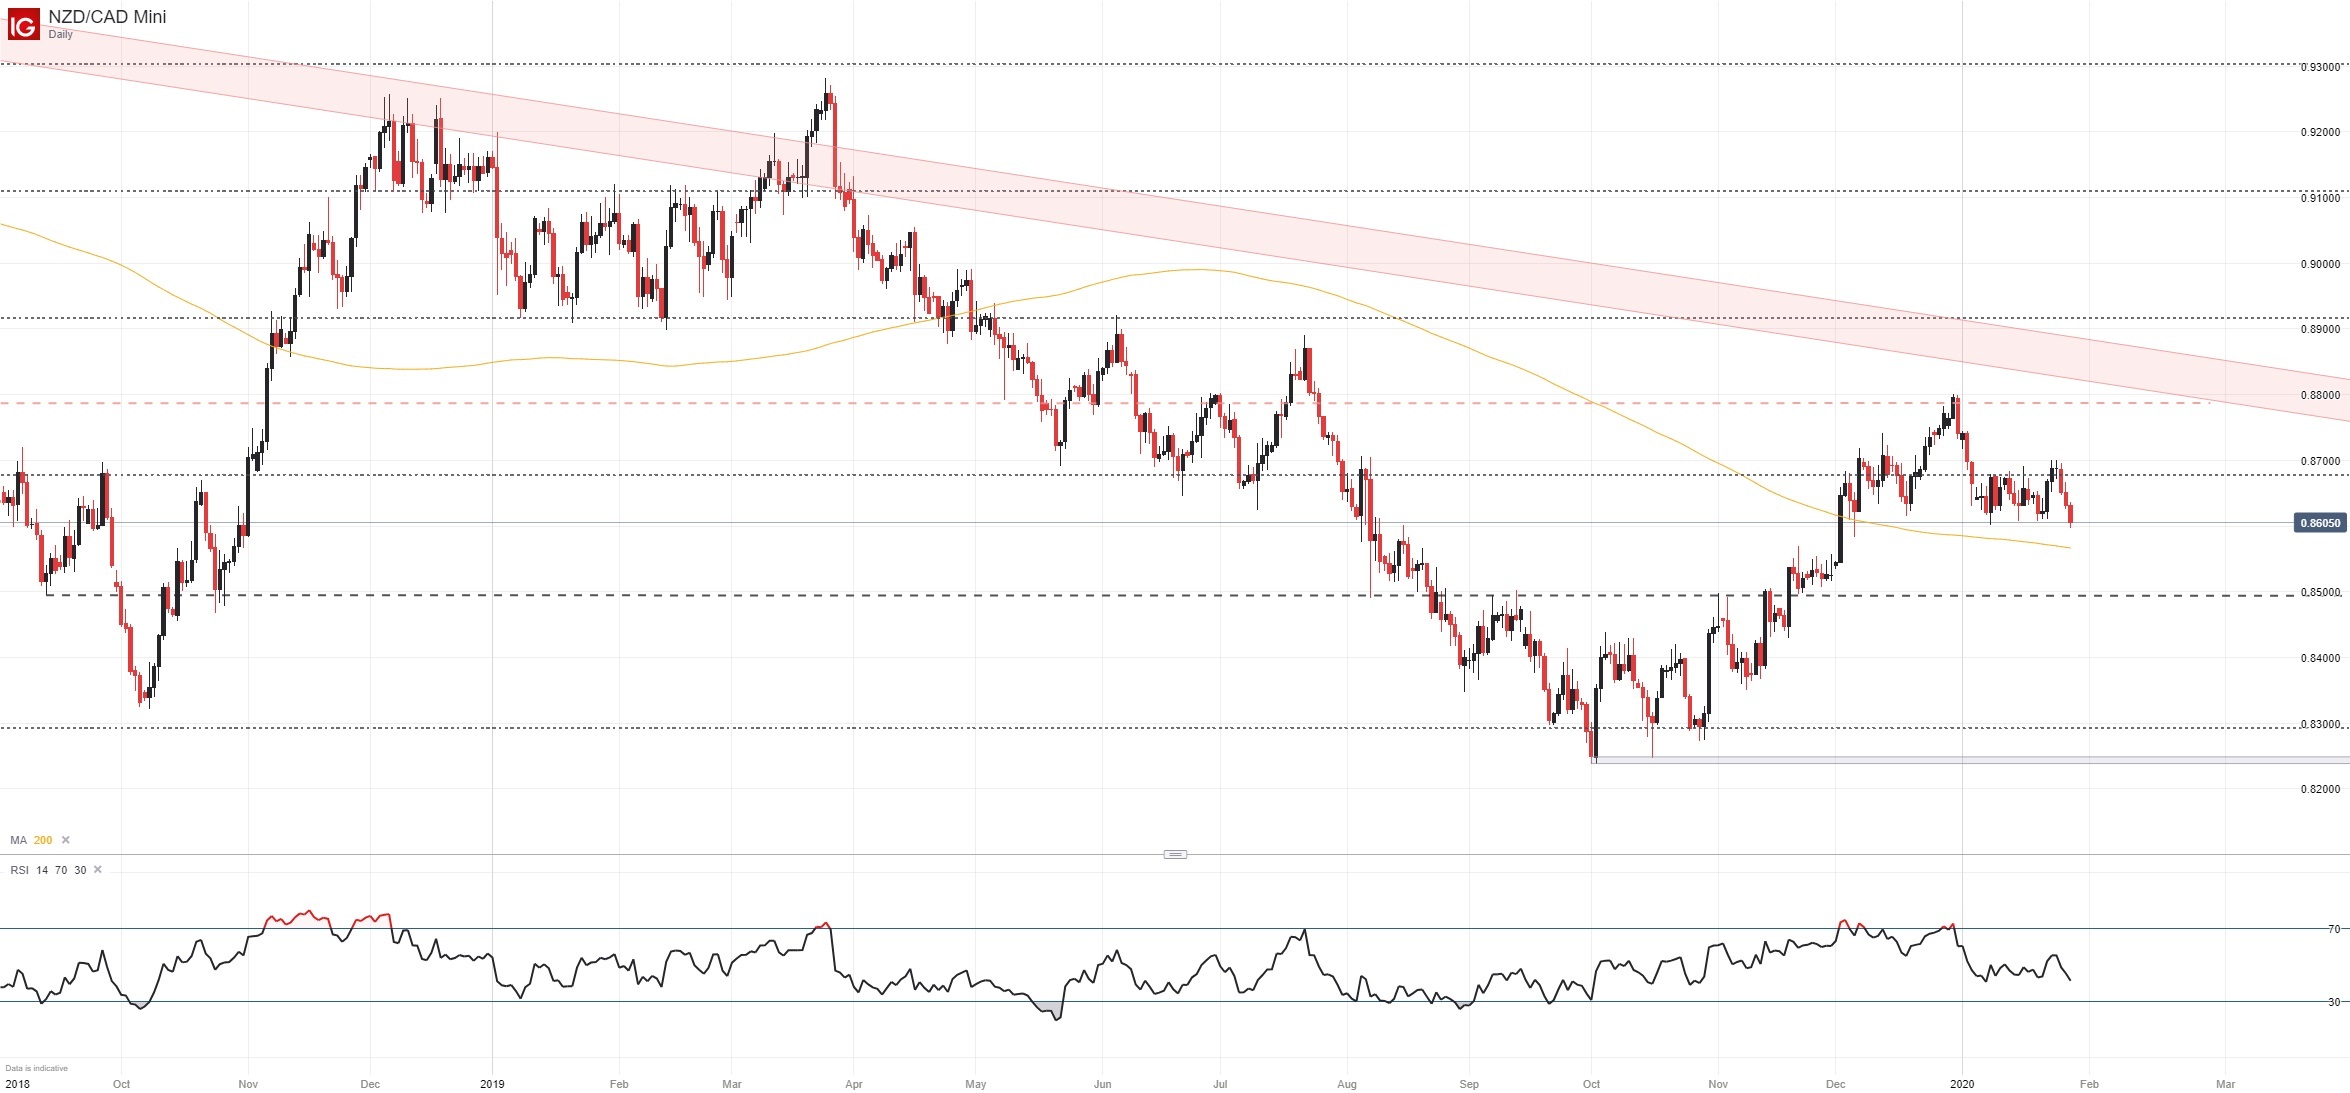
Either way, NZD weakness has prevailed recently, which leaves NZD/CAD treading water near its own 200-day simple moving average. With NZD/CAD relatively distanced from oversold territory, I prefer the technical set up in NZD/USD, but it is hard to argue the Canadian Dollar is a stronger counterpart than the Greenback in 2020 to date. Therefore, NZD/CAD may offer a more compelling overall opportunity for Kiwi strength in the short-term. In the meantime, follow @PeterHanksFX on Twitter for updates on this cross.
NZD/CAD Price Chart: Daily Time Frame (September 2018 – January 2020) (Chart 2)
AUD/NZD Forecast
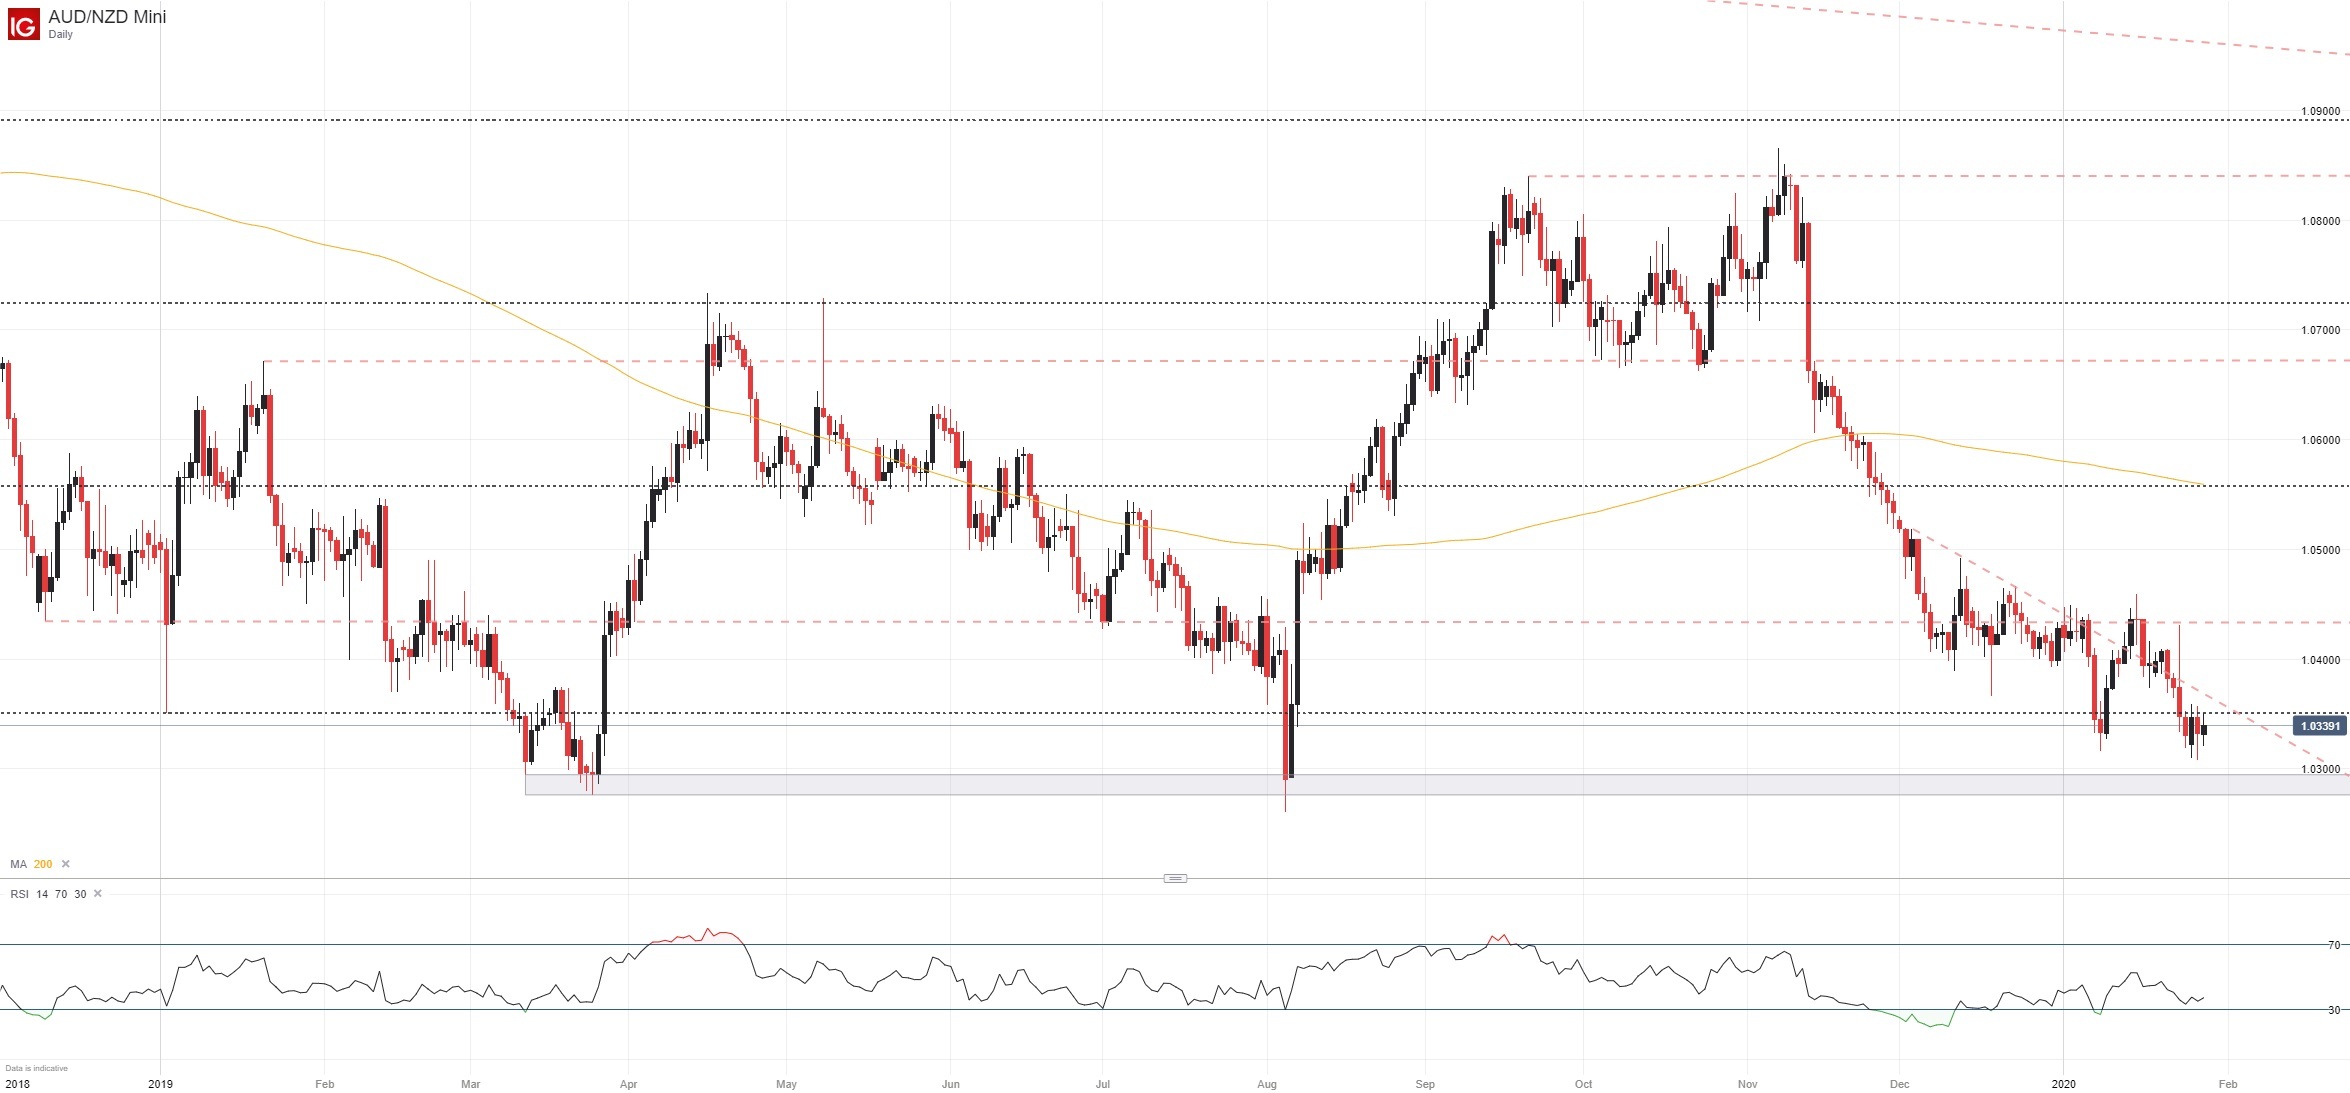
Unlike NZD/USD, AUD/NZD has been relatively indecisive. After failing to break through resistance at 1.0444 – previously identified as an area where the Kiwi would become attractive – AUD/NZD has reversed and nears support at 1.03. Now, another re-test of the level may be in order as the Australian Dollar looks to extend its decline versus NZD.
That being said, potential set ups at current levels lack the necessary risk-reward profile, in my opinion, so patience may be the best strategy.

AUD/NZD Price Chart: Daily Time Frame (December 2018 – January 2020) (Chart 3)
--Written by Peter Hanks, Junior Analyst for DailyFX.com
Contact and follow Peter on Twitter @PeterHanksFX
Read more: How to Invest During a Recession: Investments & Strategy


