


S&P 500, Dow Jones Price Analysis & News
- S&P 500 Continues to March Higher
- Dow Jones Edges Lower on Boeing
- US Equities Shrug Off Chinese Virus Concerns So Far
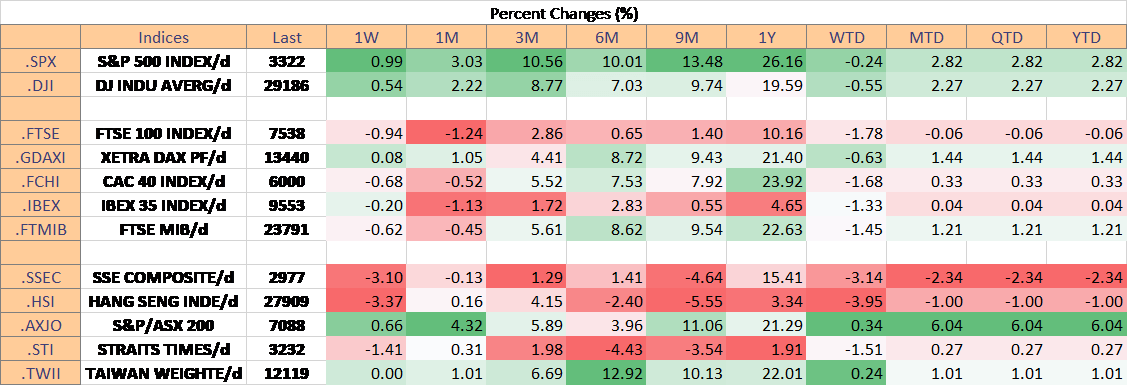
Source: Refinitiv
S&P 500: The S&P 500 has continued its march higher, hitting fresh record peaks. However, as highlighted previously, we see caution in chasing the market higher with rising risks of an overdone sell-off. DMIs signal that the grind higher can persist, although, with the negative DMI indicator at its lowest since January 2018 (prior to the sharp February 2018 sell-off), this further validates our reasoning for being cautious. While the concerns continue to mount over the China virus outbreak, which has seen Asian equities underperform, this has yet to notably spill-over onto US equities. As such, on the technical eyes are on the 3300 level, where a firm break could exacerbate a sell-off.
S&P 500 Price Chart: Daily Time Frame

Source: IG Charts
S&P 500 Momentum Indicators (DMI)

Dow Jones:Much like the S&P 500, the Dow Jones continues to trade at elevated levels. However, with Boeing, one of the largest stocks within the index, heading lower, the index has pulled back from its recent record high with the negative DMI beginning to tick higher. Although, while Boeing is scheduled to report on Jan 29th, keep in mind that Apple is also scheduled to report next week on Jan 28th. Downside sides on 28800 with a closing break putting 28500 into focus.
Dow Jones Price Chart: Daily Time Frame

Source: IG Charts
--- Written by Justin McQueen, Market Analyst
Follow Justin on Twitter @JMcQueenFX


