

Stock Market Forecast:
- The Russell 2000 broke above horizontal resistance in late November, allowing it to aim higher
- Similarly, emerging markets, via the EEM ETF, have spiked to their highest level since April
- Appetite for smaller markets and smaller companies speaks to a wider appetite for equity exposure and is an encouraging sign for further equity gains
Stock Market Forecast: Russell, EM Breakout May Suggest Another Rally
After months of failed attempts, the Russell 2000 small-cap index successfully broke above horizontal resistance in late November. Quickly, however, the RUT slipped back beneath the seemingly insurmountable level until trade optimism spurred risk appetite in December and sent the Russell driving through resistance once more.
Now, with the US-China trade war effectively in remission and an accommodative Federal Reserve, the Russell could look to reduce the gap between large and small cap indices. Further still, the demand for smaller – and effectively riskier – stocks suggest a broader desire for equity exposure and is an encouraging sign for a continuation higher in 2020.
Russell 2000 Price Chart: Daily Time Frame (October 2017 - December 2019) (Chart 1)
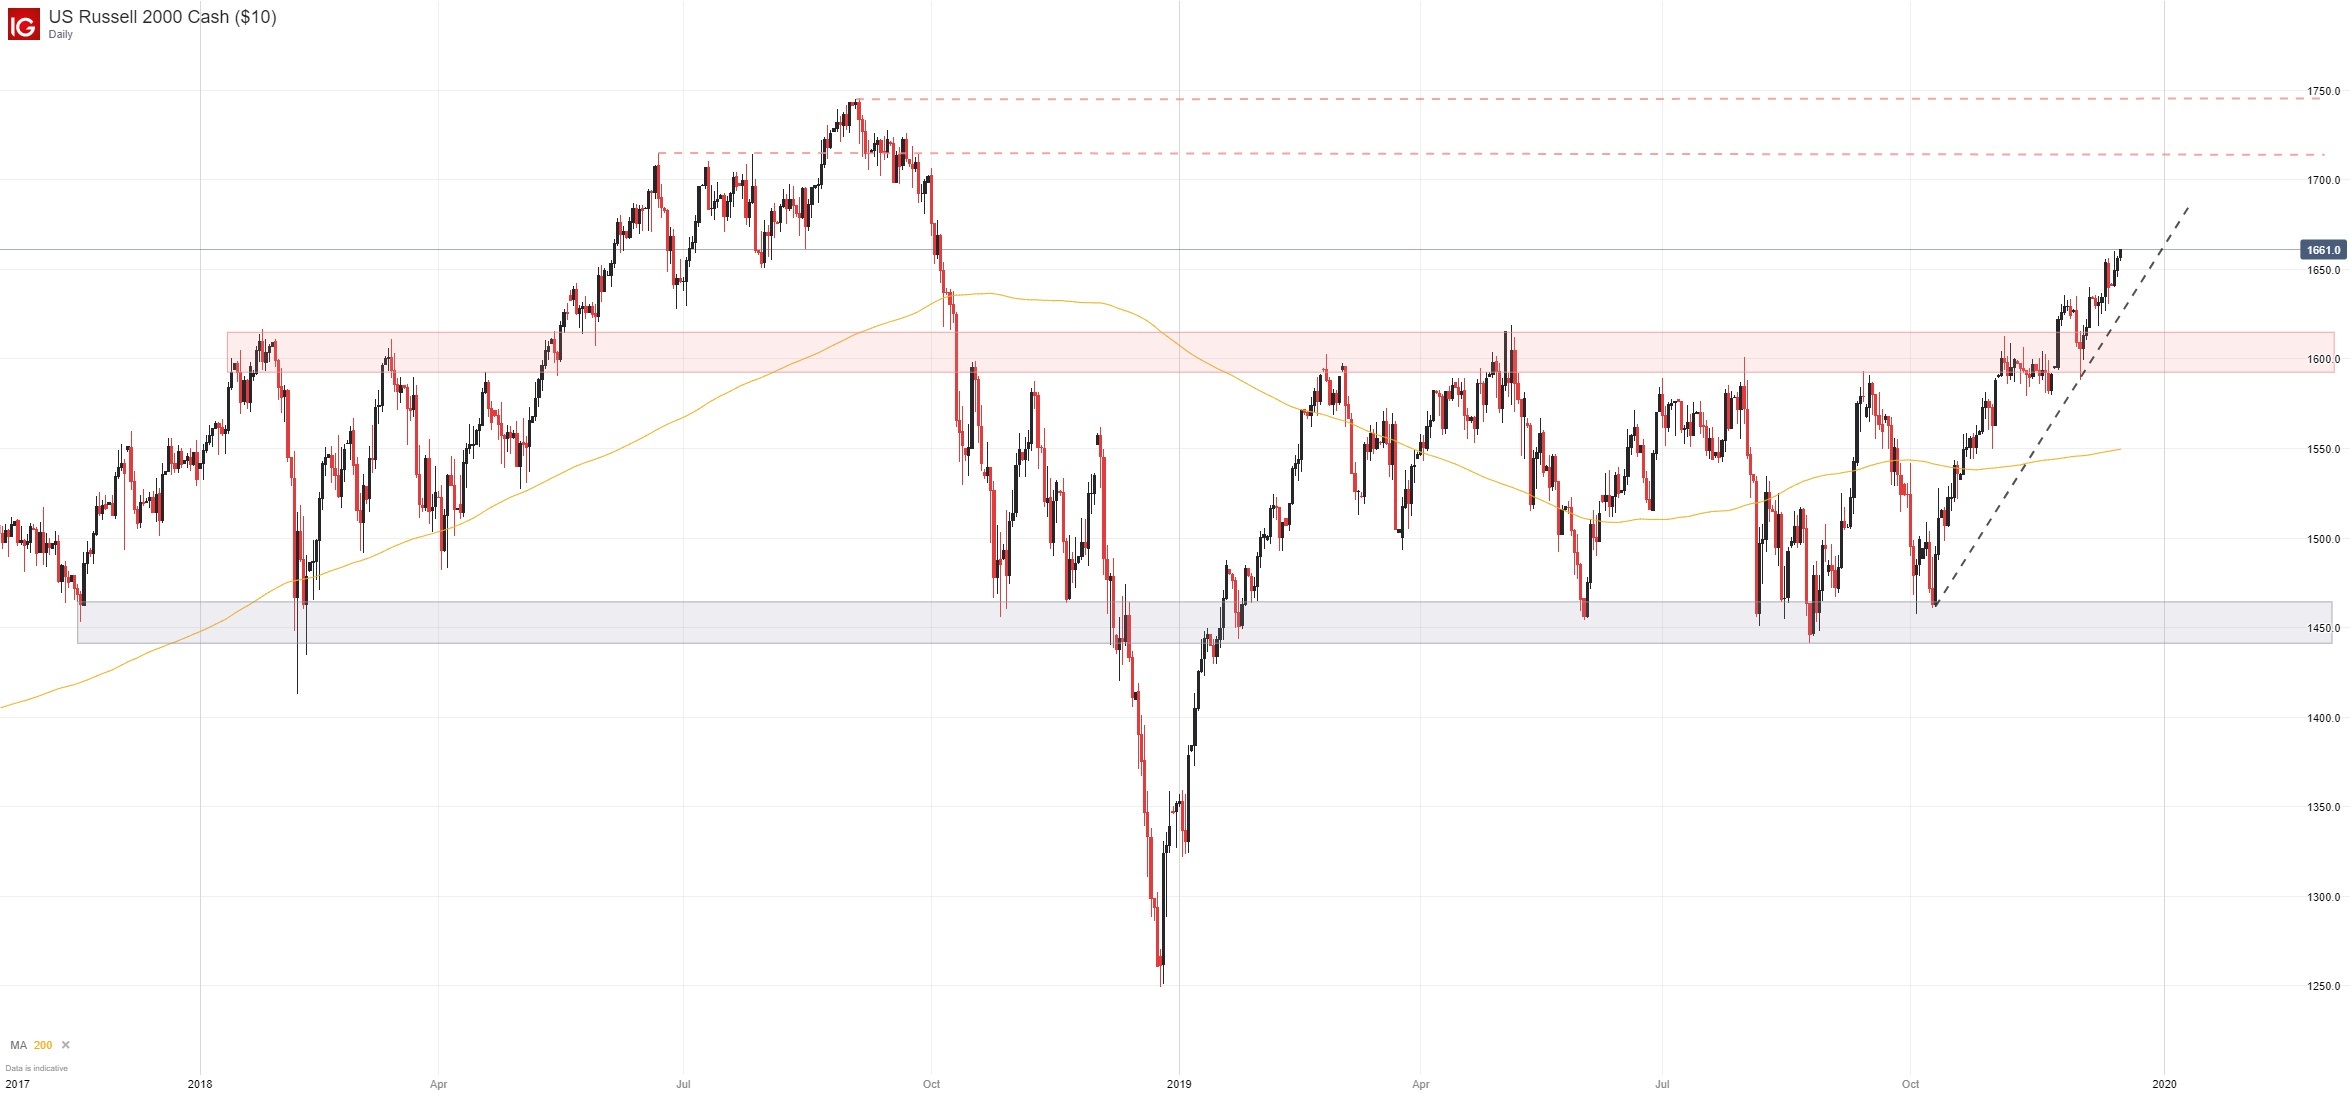
The bullish breakthrough has opened the door higher, allowing the Russell to take aim at levels not seen since last June. To that end, 1,716 will likely provide the next area of notable technical resistance as it worked stall price discovery in the past. While various levels of technical influence exist between the current trading price and 1,716, I would argue few posses the merit required to completely reverse the current trend higher.
Emerging Markets Join the Dow Jones and Russell Rally
Like the Russell 2000, emerging market equities (via the EEM ETF) broke through technical resistance of their own in mid-December. Enjoying a similar boost in risk appetite and trade optimism, a continuation higher for the growth-sensitive stocks could bolster the argument for further equity gains in the Dow Jones, S&P 500 and Nasdaq 100.
EEM ETF Price Chart: Daily Time Frame (October 2017 - December 2019) (Chart 2)
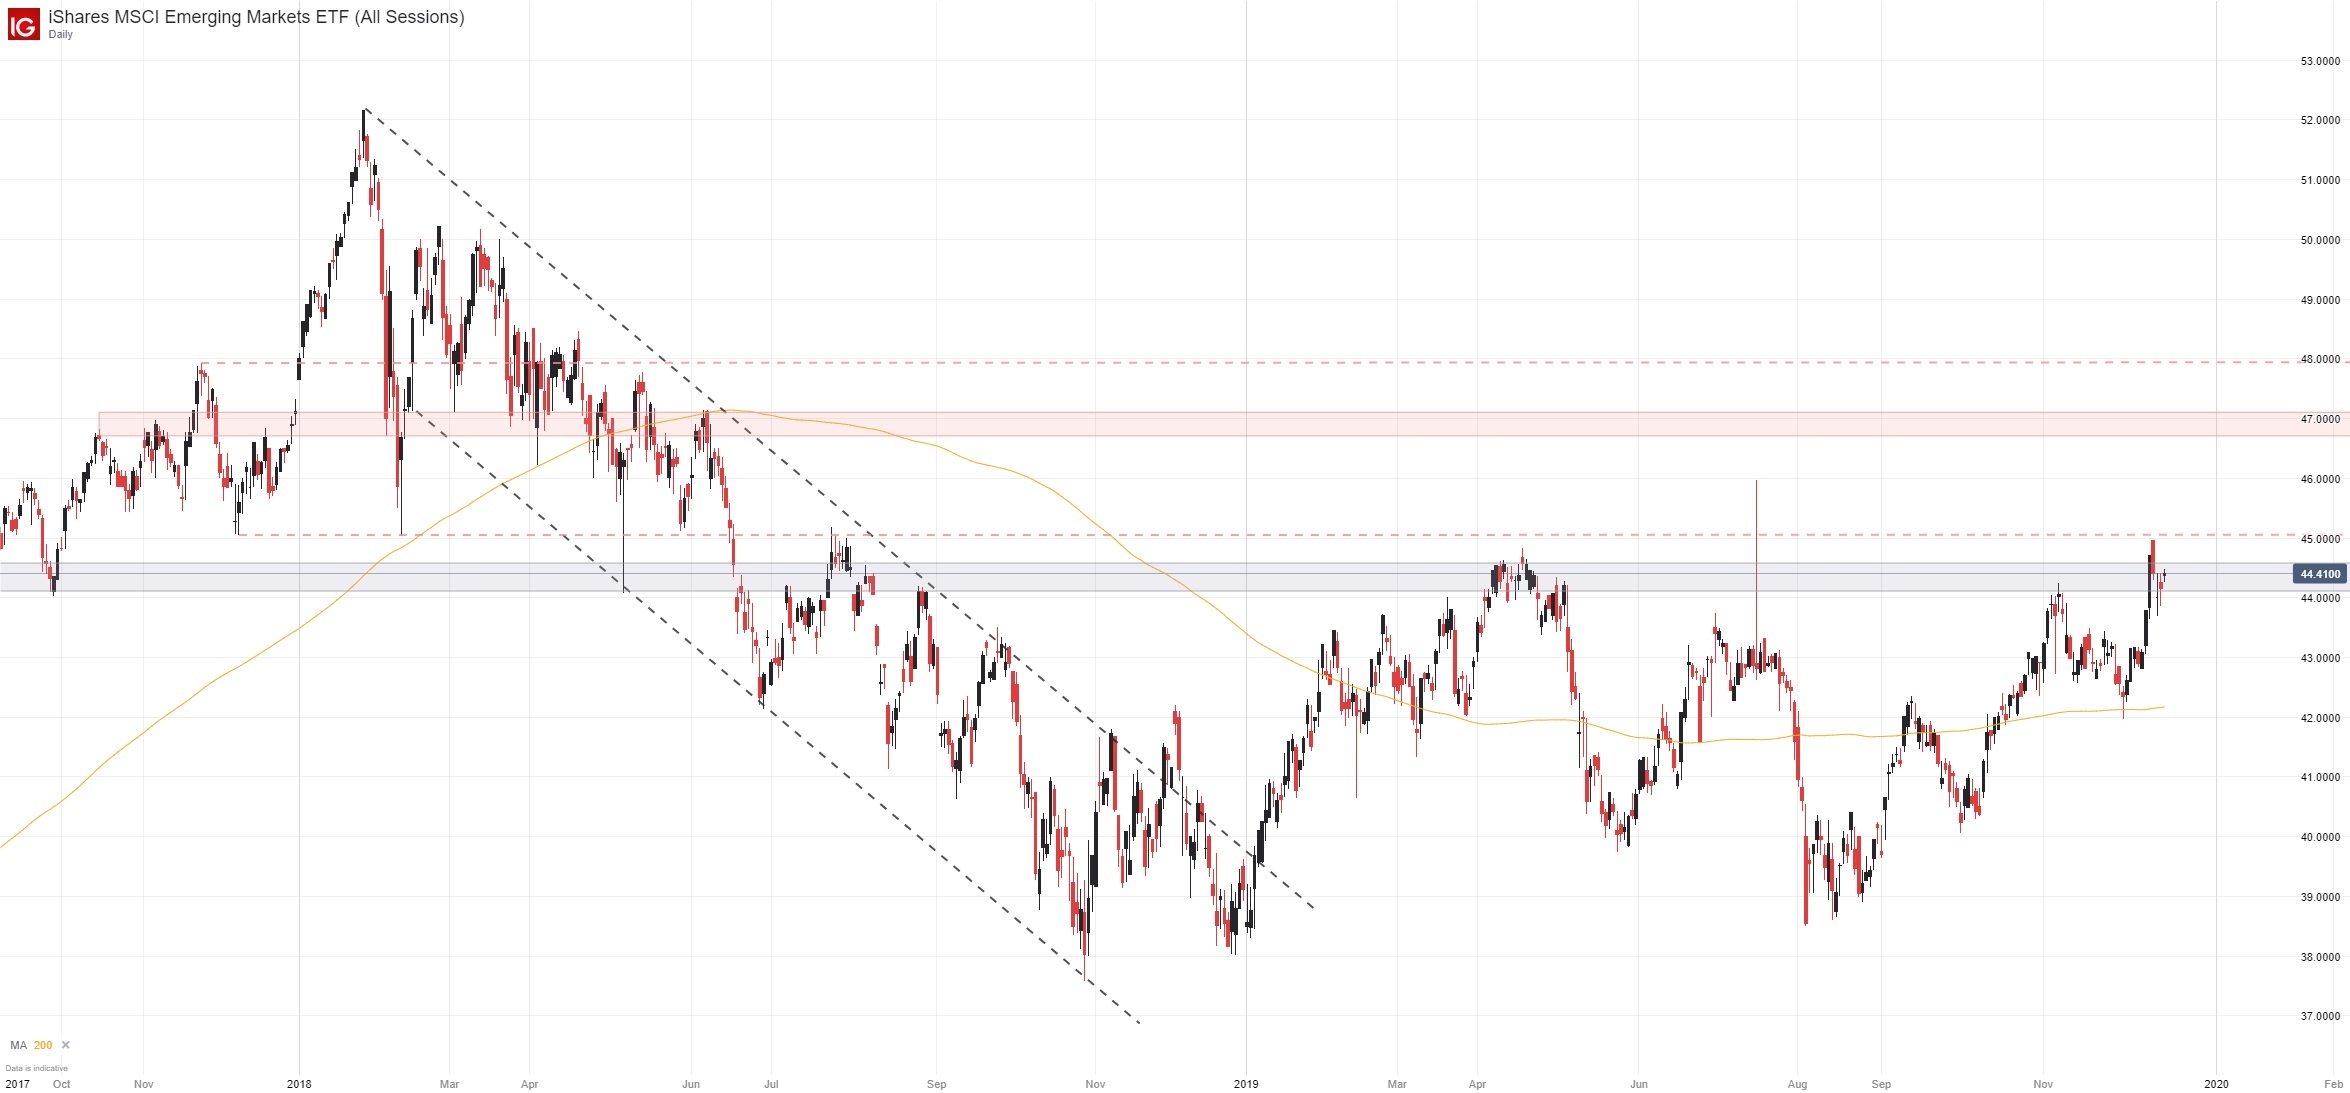
As investors become more willing to accept the higher risks associated with EM equities, similar price action may be expected in growth-associated currencies like the Australian Dollar which has recently tested longstanding trendline resistance. Given the wave of breakouts in various risk assets, it could suggest an extension higher for stocks is likely as we enter 2020.
--Written by Peter Hanks, Junior Analyst for DailyFX.com
Contact and follow Peter on Twitter @PeterHanksFX
Read more: Stock Market Crashes: Current Climate Compared to Prior Conditions