


Bitcoin (BTC) Price Forecast, Analysis and Chart:
- Limited price action as Average True Range falls.
- Bitcoin leaning on the 50-day moving average.
If you are interested in trading the cryptocurrency market, we have produced a Day Trading Guide to Bitcoin and Other Cryptocurrencies to help you better understand this highly volatile asset class.
Bitcoin (BTC) Price Action - Limited and Confusing
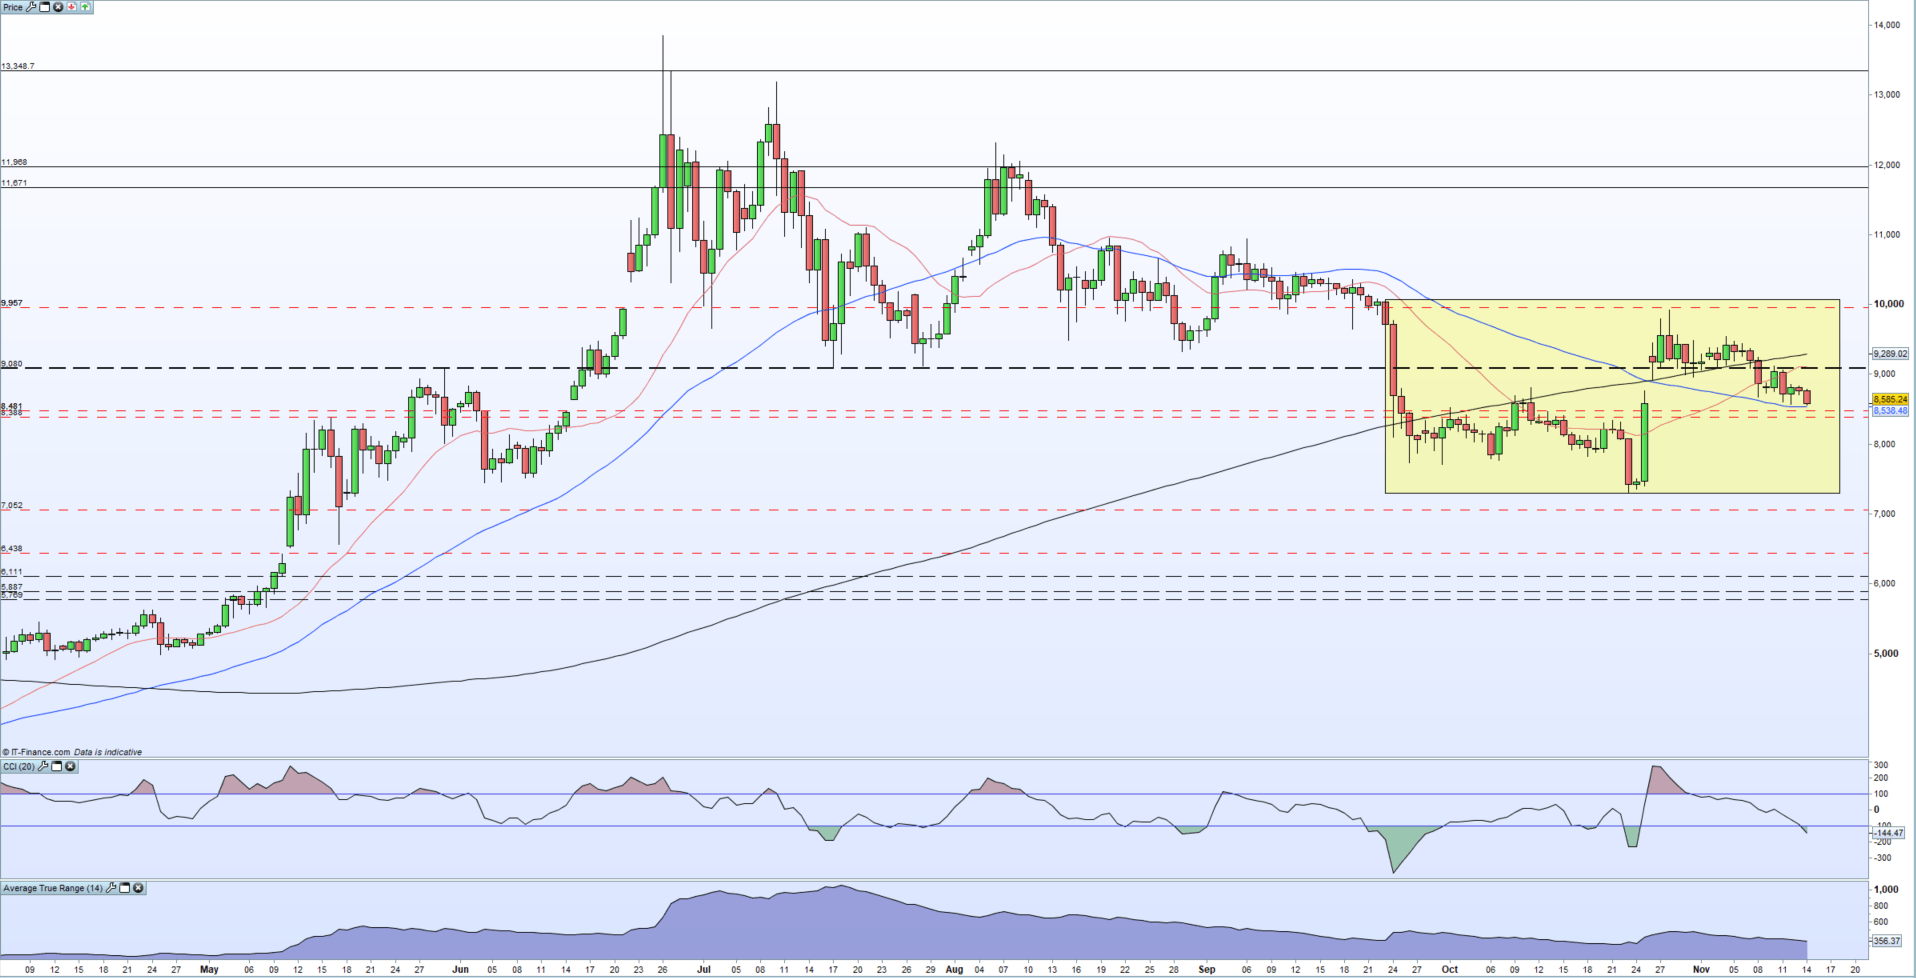
Bitcoin is going through a period of consolidation and sits in the middle of the trading range made over the last six weeks. The daily trading ranges are also tight with the Average True Range (ATR) indicator nearing its monthly low as traders remain undecided about the next move. It should be noted that Bitcoin has reacted sharply after a period of low volatility – twice in the last six weeks – and another breakout cannot be discounted.
Bitcoin (BTC) – Golden Cross/Death Cross
The spot price is currently being supported by the 50-day moving average after breaking below both the 20- and 200-dmas in the last week. The 50-dma broke below the 200-dma – a bearish death cross – at the end of October, indicating lower prices ahead. While the 50- and 200-dma crossovers are not exact, a bullish golden cross was formed back on April 24 at $4,500 which lead to a spike high of just under $14,000 on June 26.
Bitcoin (BTC) Price Levels
If Bitcoin breaks and closes below the 50-day moving average, then a re-test of the recent $7,300 low is back on the cards. The CCI indicator currently shows that Bitcoin is oversold but the IG client sentiment indicator shows that retail customers remain heavily long of BTC. A break to the upside will meet 20- and 200-day moving average resistance at $9,100 and $9,300 respectively.
Bitcoin (BTC) Daily Price Chart (April – November 14, 2019)
IG Client Sentiment shows that how traders are positioned in a wide range of assets and markets. Retail customers are 83% net-long Bitcoin, a bearish contrarian bias. However, daily and weekly positional shifts give us a mixed outlook.
Traders may be interested in two of our trading guides – Traits of Successful Traders and Top Trading Lessons – while technical analysts are likely to be interested in our latest Elliott Wave Guide.
What is your view on Bitcoin (BTC) – bullish or bearish?? You can let us know via the form at the end of this piece or you can contact the author at nicholas.cawley@ig.com or via Twitter @nickcawley1.


