

EUR/USD Price Forecast, Analysis and Chart:
- EUR/USD unable to break the 200-day moving average.
- US data released later today may push the pair lower.
Brand New Q4 2019 USD and EUR Forecast and Top Trading Opportunities
EUR/USD Technical Outlook
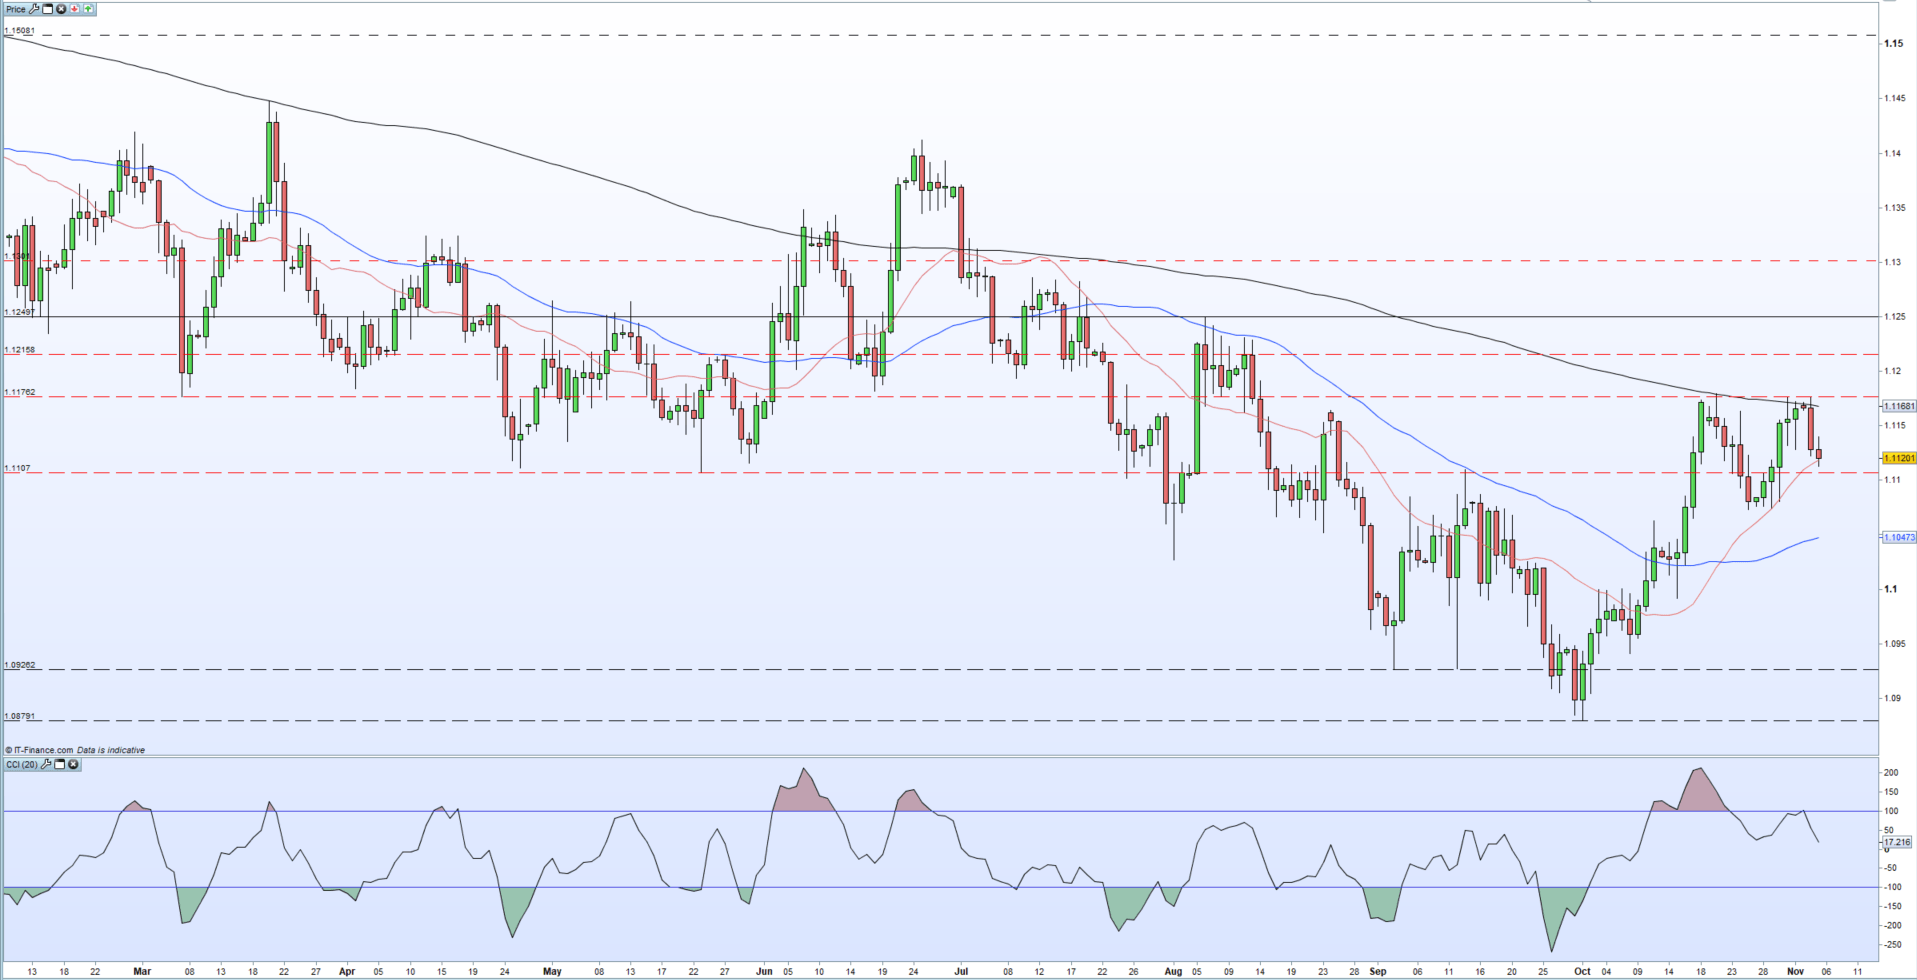
EUR/USD is setting itself up to test the 1.1100 big figure level and the 1.1073 October 25 low print as buyers give up on trying to break higher. The 200-day moving average (black line on the chart) continues to thwart any upside momentum with the indicator capping EUR/USD price action for the last four months. Just above here, sits the 1.1180 multi-week high which the pair rejected yesterday. EUR/USD is now trading either side of the 20-day moving average at 1.1118 which guards the October 25 low. Below here the 50-day moving average may provide some support at 1.1074 before the October 15 swing-low at 1.0992.
EURUSD Daily Price Chart (February - November 5, 2019)
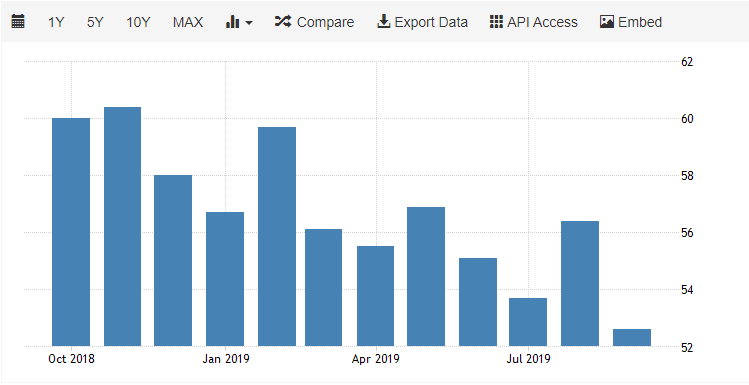
Later today, US data may provide another stimulus for the pair. The closely watched ISM non-manufacturing/services composite release at 15:00 GMT is expected to show a pick-up to 53.4 against last month’s (September) reading of 52.6, its lowest level since April 2016. Last month’s release missed expectations of 55 and caused a notable downturn in the US dollar. According to the latest CoT report, EUR/USD speculator remain heavily short of the pair.
US Non-Manufacturing ISM – Chart via Trading Economics
DailyFX Economic Calendar
IG Client Sentiment shows that traders are 54% net-short EURUSD, a bullish contrarian bias.However recent daily and weekly positional changesgive us a mixed outlook.
Traders may be interested in two of our trading guides – Traits of Successful Traders and Top Trading Lessons – while technical analysts are likely to be interested in our latest Elliott Wave Guide.
What is your view on the Euro and the US Dollar – bullish or bearish?? You can let us know via the form at the end of this piece or you can contact the author at nicholas.cawley@ig.com or via Twitter @nickcawley1.