


Bitcoin, Ethereum, Ripple: Prices, Charts and Analysis
- Sharp turnaround in sentiment.
- Technical set-up looks negative.
Cryptocurrency Market: Bitcoin May Re-Test Multi-Month Low
After a positive start to 2019 with prices drifting gently higher, selling returned with a bang to the cyrptocurrency space, backed by a sizeable pick-up in volume.
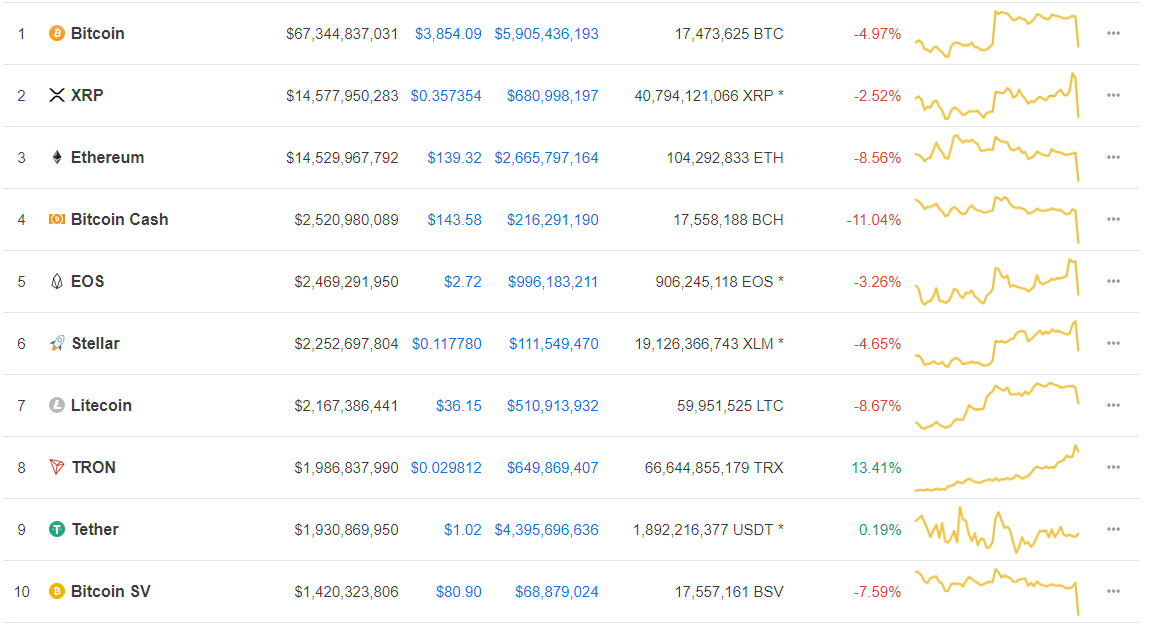
Double-digit losses were recorded in some coins, while Ripple overtook Ethereum to become the second largest token by market capitalization. The selling was accompanied by heavy turnover – just under $20 billion – normally a bearish sign, especially after the quiet market conditions this week to date. The cryptocurrency market as a whole lost just under $9 billion in one hour.
If you are interested in trading the cryptocurrency market, we have produced a Day Trading Guide to Bitcoin and Other Cryptocurrencies to help you better understand this highly volatile asset class.
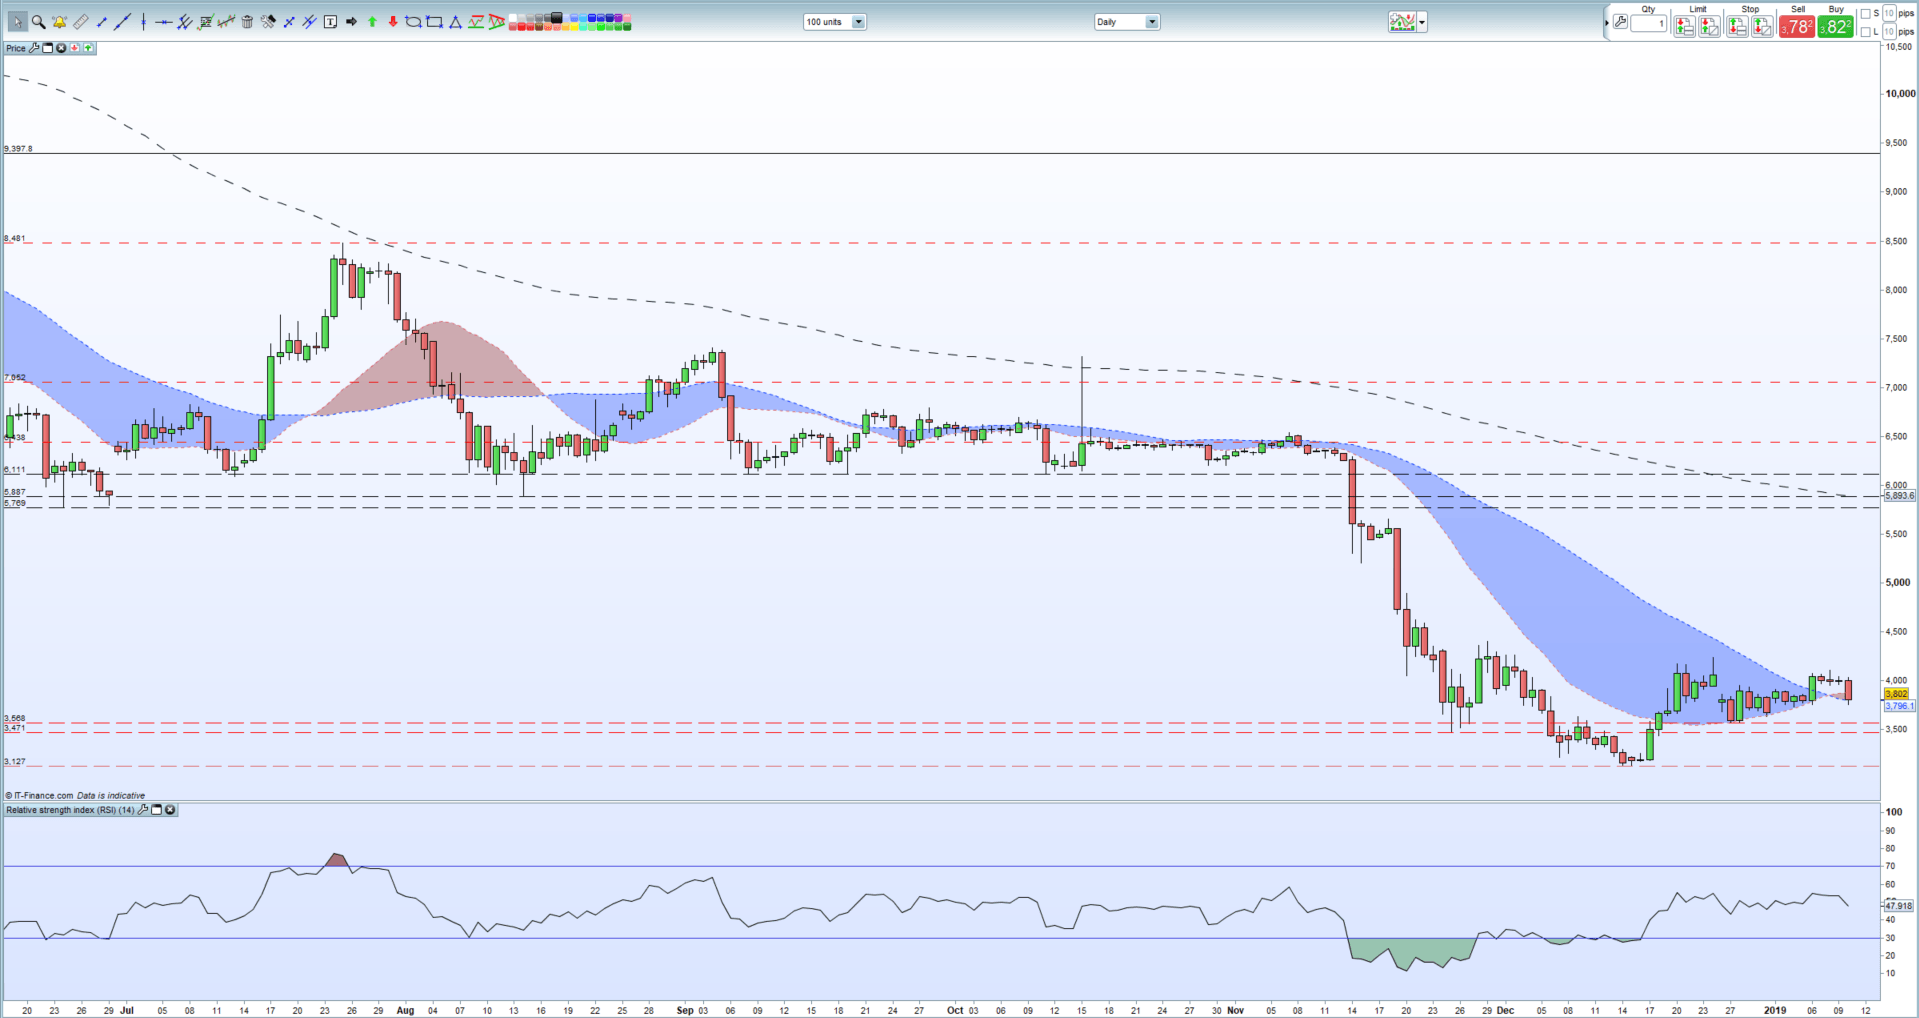
Bitcoin: Charts Indicate Further Losses
The technical set-up for the largest cryptocurrency looks negative in the short-term and further losses look likely. To the downside, horizontal support appears at $3,568 followed closely by $3,471 and then the 15-month low at $3,127 made in mid-December. To the upside, $4230 needs to be broken and closed above to allow Bitcoin to attempt to close the gap on the November 19 candle betweet $4,895 and $5,195.
Bitcoin (BTC) Daily Price Chart (June 2018 – January 10, 2019)
If you are interested in learning more about technical analysis and how to construct a trading plan, visit the DailyFX University where our experts will help you build your trading skills.
Investors remain net-long cryptocurrencies but recent changes give us a mixed trading bias across the space with some cryptos showing bullish contrarian readings while other remian negative. You can sign up to the IG Client Sentiment Indicator for free to get updated positioning data.
Cryptocurrency Trader Resources – Free Practice Trading Accounts, Guides, Sentiment Indicators and Webinars
If you are interested in trading Bitcoin, Bitcoin Cash, Ethereum, Litecoin or Ripple we can help you begin your journey. We have an Introduction to Bitcoin Trading Guide along with daily analysis to ensure that you are aware of the potential technical and fundamental drivers of price action.
--- Written by Nick Cawley, Analyst.
What’s your opinion on the latest cryptocurrency slump? Share your thoughts and ideas with us using the comments section at the end of the article or you can contact me on Twitter @nickcawley1 or via email at nicholas.cawley@ig.com.
--- Written by Nick Cawley, Analyst.


