


USD Analysis and Talking Points
- Federal Reserve QT to Spur Short Term USD Rise
- Fed balance sheet will lead to a net negative impact on US liquidity of $17.4bln
See our Brand New Q4 FX forecast to learn what will drive major currencies throughout the quarter.
Federal Reserve QT to Spur Short Term USD Rise
Last year the Federal Reserve announce that they would slowly begin to shrink the Federal Reserve balance sheet from October, starting at a rate of $6bln/month and working up to a maximum of $50bln, in order to unload the $4.5tln of bonds acquired by the central bank through its QE program.The Fed has been rolling over its holdings of debt on expiry date, however it is now in the process of letting the debt roll off its balance sheet and redeeming the full amount paid for the bonds, creating a demand for Dollars in the process.
Short term Impact on the USD
Typically, on days with a large and negative impact USD liquidity, the Dollar has tended to gain while risk sentiment has been softer. November 15th will mark the next redemption day in which the shrinking Fed balance sheet will lead to a net negative impact on US liquidity by around $17.4bln.
| Dates | Par Value | Daily Impact on US Liquidity | Monthly Cap | USD Performance |
|---|---|---|---|---|
| Oct 31st 2017 | $8.7bln | -$6bln | $6bln | 0% |
| Nov 15th 2017 | $11bln | -$3.5bln | $6bln | 0% |
| Nov 30th 2017 | $7.9bln | -$2.5bln | $6bln | -0.1% |
| Dec 31st 2017 | $17.5bln | -$6bln | $6bln | 0.1% |
| Jan 31st 2018 | $27.6bln | -$12bln | $12bln | 0% |
| Feb 15th 2018 | $16.6bln | -$4.1bln | $12bln | -0.6% |
| Feb 28th 2018 | $32bln | -$7.9bln | $12bln | 0.3% |
| Mar 31st 2018 | $31.2bln | -$12bln | $12bln | 0.1% |
| Apr 30th 2018 | $30.4bln | -$18bln | $18bln | 0.3% |
| May 15th 2018 | $26.2bln | -$8.6bln | $18bln | 0.7% |
| May 31st 2018 | $28.5bln | -$9.4bln | $18bln | -0.1% |
| Jun 30th 2018 | $30.5bln | -$18bln | $18bln | 0.4% |
| Jul 31st 2018 | $28.5bln | -$24bln | $24bln | 0.5% |
| Aug 15th 2018 | $23.1bln | -$12.6bln | $24bln | 0.0% |
| Aug 31st 2018 | $20.9bln | -$11.4bln | $24bln | 0.4% |
| Sep 30th 2018 | $19bln | -$19bln | $24bln | 0.4% |
| Oct 31st 2018 | $22.9bln | -$22.9bln | $30bln | 0.1% |
| Nov 15th 2018 | $34.3bln | -$17.4bln | $30bln | |
| Nov 30th 2018 | $24.9bln | -$12.9bln | $30bln | |
| Dec 31st 2018 | $18.2bln | -$18.2bln | $30bln |
Source: Federal Reserve
Long USD on SOMA Days
Based on the past 5 SOMA redemption days, long USD via EUR has been a good proposition, given that these days have on average coincided with the Dollar index moving higher by 0.28% with a hit ratio above 70%. Consequently, this could see the USD firm against its major counterparts for much of the session.
US Dollar Price Chart: Daily Time Frame (June-November 2018)
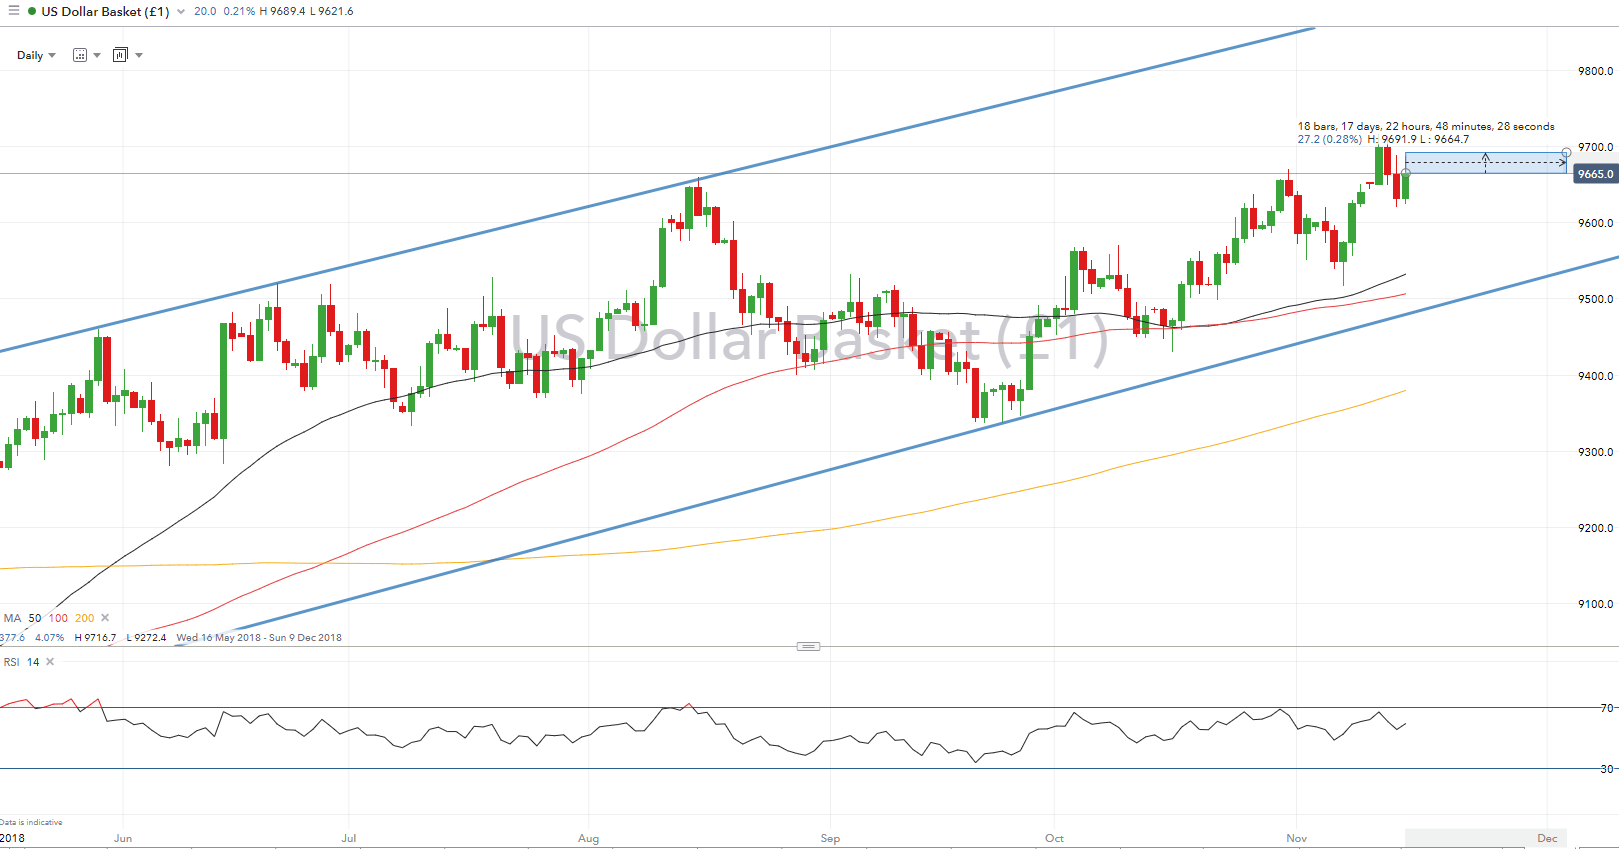
With Fed QT days typically leading to a 0.3% gain in the US Dollar (based on past 5 sessions). This could see the USD moving back towards YTD highs. While the USD has added support from the plunge in the Pound as PM May stares into the Brexit abyss with several resignations from key MPs.
USD TRADING RESOURCES:
- Just getting started? See our beginners’ guide for FX traders
- Having trouble with your strategy? Here’s the #1 mistake that traders make
--- Written by Justin McQueen, Market Analyst
To contact Justin, email him at Justin.mcqueen@ig.com
Follow Justin on Twitter @JMcQueenFX


