AUDUSD Analysis and Talking Points
- Ongoing trade war dispute keeps AUD on the backfoot
- Widening rate differentials given the Fed’s tightening path calls for lower Aussie
Trade Wars Continue to Grip the Australian Dollar
The ongoing trade war dispute between the US and China continue to weigh on the Australian Dollar with sellers in full control. Reports this morning noted that China will ask the WTO for permission to impose sanctions on the US. That said, with both nations showing no signs of backing down from the trade dispute as the Trump administrations plans to impose tariffs on $200bln worth of Chinese and an additional $267bln, while China promises to retaliate. The outlook for the Australian Dollar looks to remain soft in the short term.
AUD Bears Target January 2016 Lows
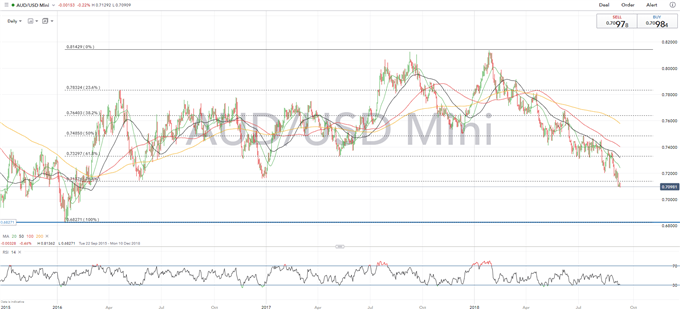
The Australian Dollar has failed to receive a notable recovery from the persistent losses from the beginning for the year. As such, AUDUSD is now trading at the lowest level since Q1 2016 with bears eying the Jan lows at 0.6827. Notable option expiries at 0.7100 may stem some of the losses for now, however, a break through the 30-month low at 0.7092 could extend a move towards the psychological 0.70 handle.
Widening Rate Differentials Moving in Favour of USD vs. AUD
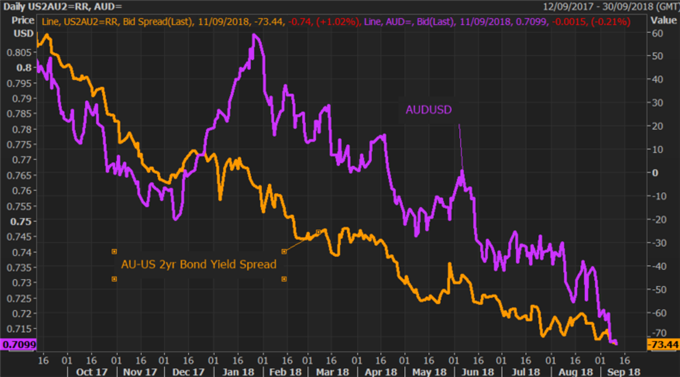
The RBA’s inaction is in stark contrast to the Federal Reserve who have pointed towards two more rate hikes this year, while 3 rates hikes in 2019 are also pencilled in. Subsequently, this has prompted US yields to surpass Australian bond yields which in turn increases the attractiveness of the USD over the AUD as investors search for yield. 2yr US bond yields are now 73bps more than Australian 2yrs. As such, the continued widening of the US-AU bond spread suggests that more losses are on the horizon for AUDUSD.
AUD/USD and Australian-US 2yr Bond Spread Chart

Source: Thomson Reuters
AUDUSD PRICE CHART: Daily Time Frame (January 2018-July 2018)

Where Next for AUDUSD?
According to IG Client Positioning data shows 75.5% of traders are net-long with the ratio of traders long to short at 3.09 to 1. In fact, traders have remained net-long since Jun 05 when AUDUSD traded near 0.7578; price has moved 6.2% lower since then. The number of traders net-long is 0.8% higher than yesterday and 4.7% higher from last week, while the number of traders net-short is 4.2% lower than yesterday and 18.6% lower from last week.
We typically take a contrarian view to crowd sentiment, and the fact traders are net-long suggests AUDUSD prices may continue to fall. Traders are further net-long than yesterday and last week, and the combination of current sentiment and recent changes gives us a stronger AUDUSD-bearish contrarian trading bias.
--- Written by Justin McQueen, Market Analyst
To contact Justin, email him at Justin.mcqueen@ig.com
Follow Justin on Twitter @JMcQueenFX


