Asia & Pacific Market Open – Fed, Jackson Hole, US Dollar, S&P 500, Nikkei 225
- Fed hawkish were disappointed as Chair Jerome Powell spoke at Jackson Hole
- The US Dollar dipped as stocks rose, the anti-risk Japanese Yen may fall ahead
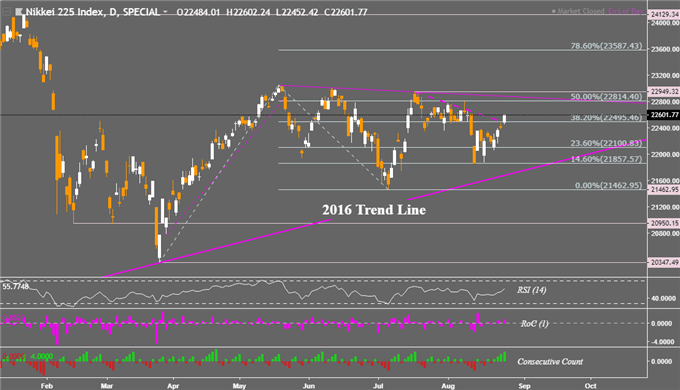
- Nikkei 225 climbed above near-term resistance and now approaches a trend line
Check out our 3Q forecasts for currencies like the Yen in the DailyFX Trading Guides page
The US Dollar suffered its second week of losses, with declines amplified as Fed Chair Jerome Powell spoke at the Jackson Hole Central Banking Symposium on Friday. While he did reiterate much of the status quo that gradual hikes are likely appropriate, a lack to go beyond that left hawks rather disappointed. Indeed, US government bond yields declined across the board.
For stocks, the risk that the Fed could have dialed up hawkish rhetoric dissipated, allowing the S&P 500 to clock in a record high after struggling to do so for most of this week. In fact, it was a rather rosy day for global benchmark indexes as they climbed during both the European and US trading sessions. Gold prices, which typically behave as an anti-fiat asset, soared the most in a day since May 2017.
The anti-risk Japanese Yen thus ended up one of the worst performing FX majors while the sentiment-linked Australian and New Zealand Dollars rose. Gains in the former were also amplified when political uncertainty in Australia declined. After struggling to hold on to his leadership, Prime Minister Malcolm Turnbull was ousted by former Treasurer Scott Morrison.
With that in mind, the beginning of this week could be met with an improvement in market mood as Asia/Pacific stocks cheer somewhat diminished prospects of global tightening credit conditions. This may allow the Yen to resume its depreciation while the Aussie and Kiwi Dollars receive more fuel to their upside momentum.
Nikkei 225 Technical Analysis – Above Resistance
The rally in stocks on Friday allowed the Nikkei 225 to clock in its 4th consecutive gain on the daily chart, the longest winning streak since July 18th. The index has also pushed above a near-term descending resistance line, hinting that it may rise in the near-term. From here, immediate resistance is the 50% Fibonacci extension at 22,814 followed by a trend line that connects the May, June and July highs.

Chart created in TradingView
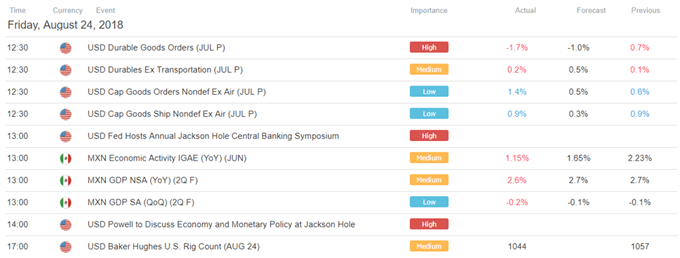
US Trading Session

Asia Pacific Trading Session

** All times listed in GMT. See the full economic calendar here
FX Trading Resources
- Having trouble with your strategy? Here’s the #1 mistake that traders make
- See how equities are viewed by the trading community at the DailyFX Sentiment Page
- Join a free Q&A webinar and have your trading questions answered
- Just getting started? See our beginners’ guide for FX traders
--- Written by Daniel Dubrovsky, Junior Currency Analyst for DailyFX.com
To contact Daniel, use the comments section below or @ddubrovskyFX on Twitter


