
USDJPY Price, News and Analysis
- USDJPY nears a fresh year-to-date high.
- Technical analysis shows USDJPY overbought but retail remain short.
IG Client Sentiment shows traders are further net-short USDJPY than yesterday and last week, and the combination of current sentiment and recent changes gives us a stronger USDJPY-bullish contrarian trading bias.
USDJPY Likely to Move Higher; Dips May Provide Opportunities
USDJPY continues its breakout higher as trade tensions ease for now, dragging the risk-averse JPY lower. In addition, recent strong US economic data is pushing the greenback back towards multi-month highs as the interest rate differential between the US and Japan widens further. The Japanese two-year is trading at -0.129% while the US equivalent offers 2.595%.
Updated Q3 DailyFX USD and JPY Analysis and Forecasts.
US Dollar Basket Daily Price Chart (October 2017 – July 13, 2018)
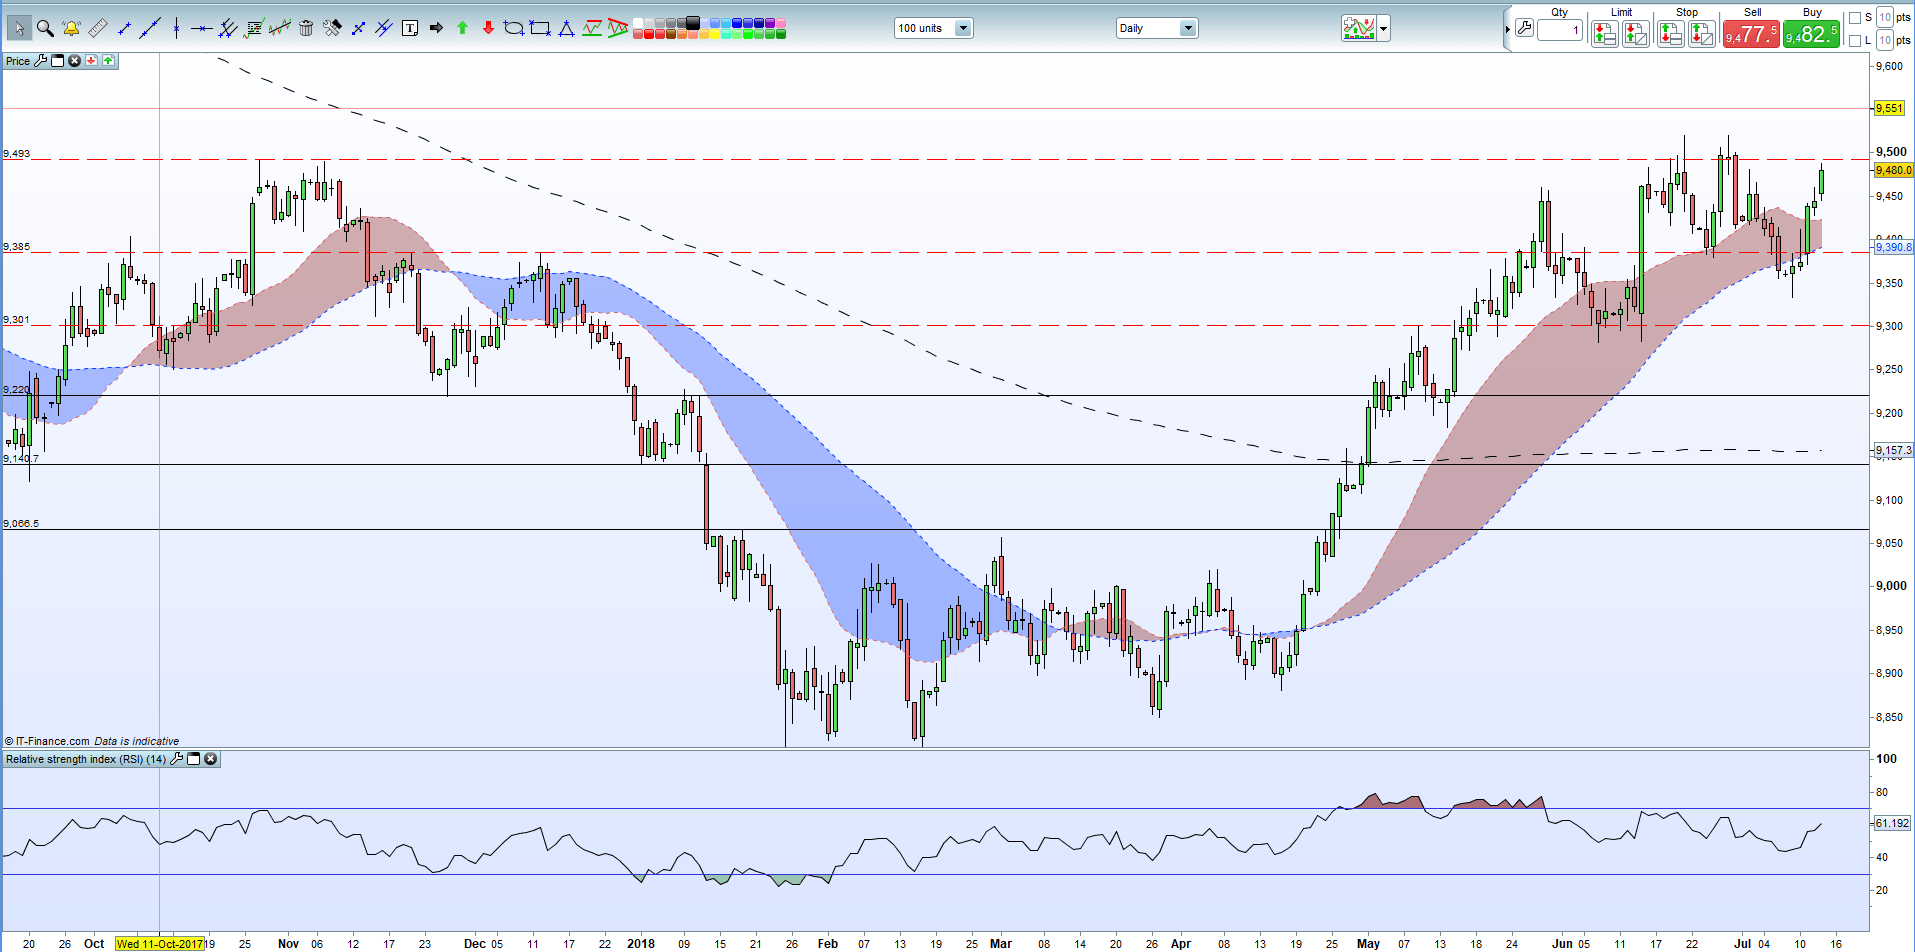
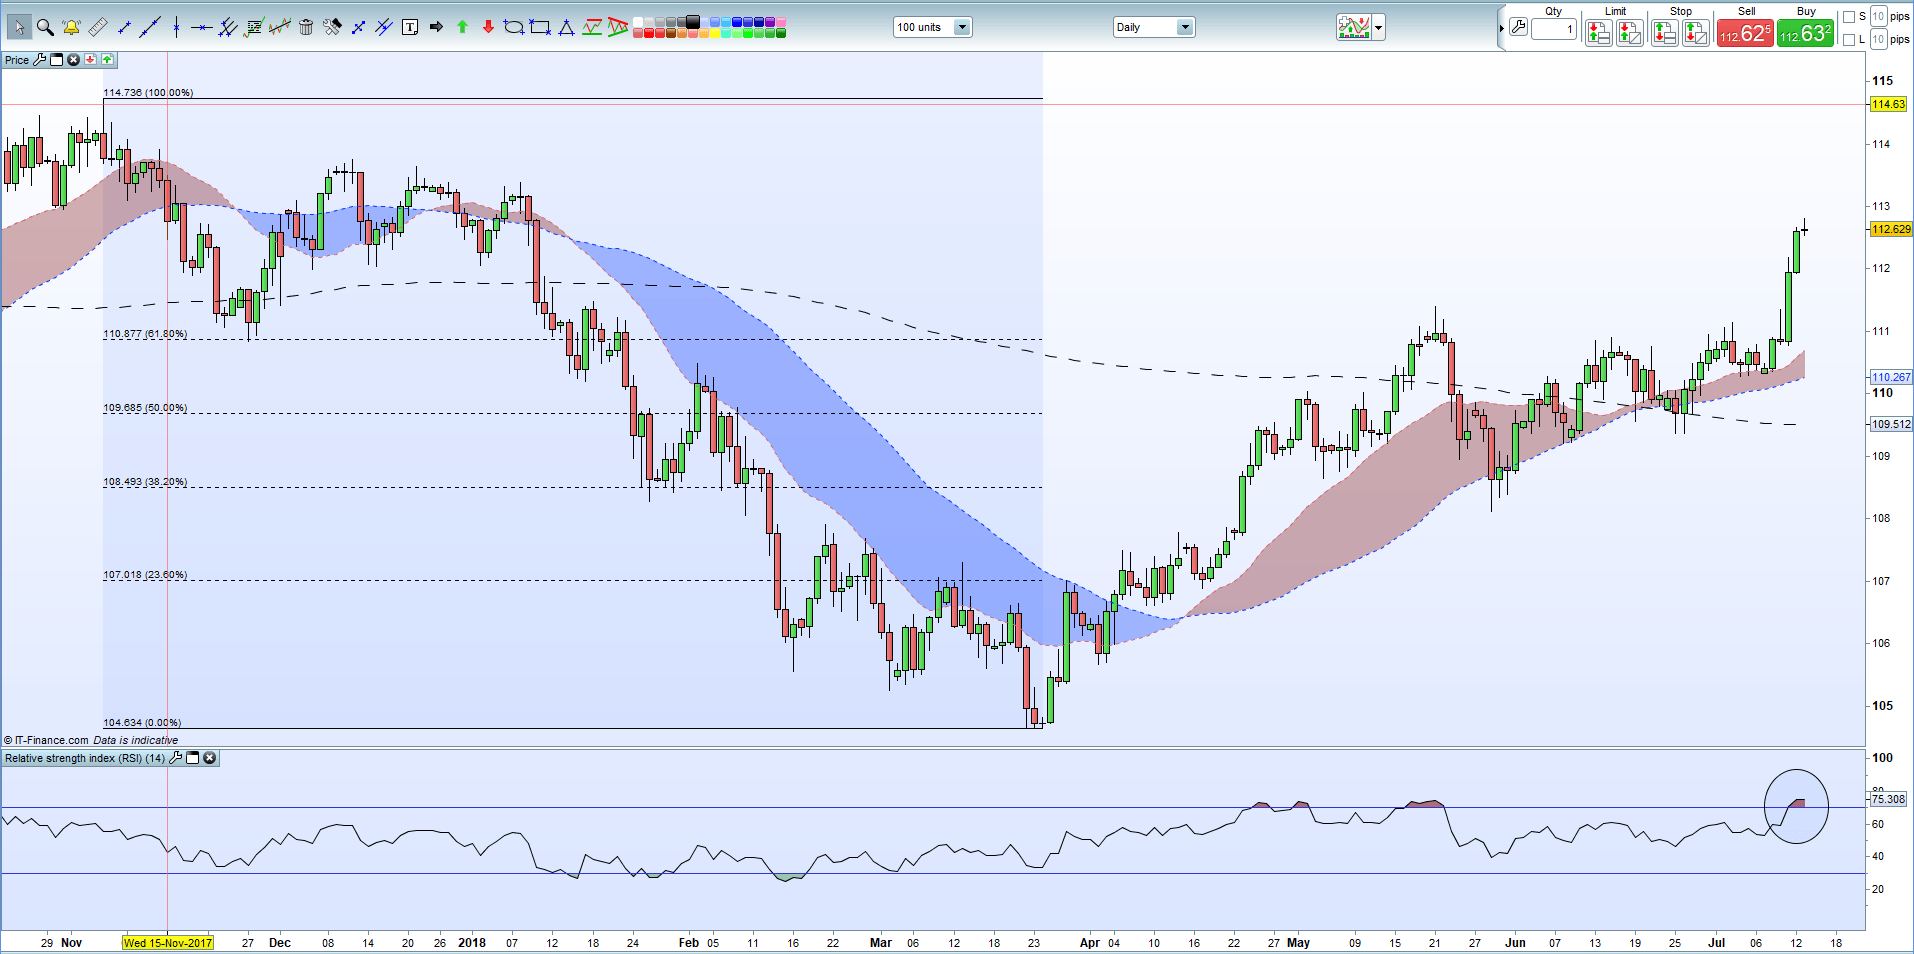
While fundamental analysis suggest that USDJPY will move higher, one technical indicator is flashing a warning signal and may dampen the move in the short-term. The Relative Strength Index (RSI) is trading in overbought territory and normally signals either an upcoming sell-off or at the least a period of consolidation. If the current political/trade war backdrop remains the same – and that may be a big if – any move lower may encourage dip-buying, with the May high at 111.400 and the 61.8% Fibonacci retracement at 110.877 the likely targets.
If retail sentiment is followed (see above) then traders who remain short of USDJPY may use any sell-off to cover their shorts. On the upside the December 12 high at 113.753 is the next target which then opens the way to the November 6 high at 114.736.
USDJPY Daily Price Chart (October 2017 – July 13, 2018)
DailyFX has a vast amount of updated resources to help traders make more informed decisions. These include a fully updated Economic Calendar, and a raft of Educational and Trading Guides
--- Written by Nick Cawley, Analyst
To contact Nick, email him at nicholas.cawley@ig.com
Follow Nick on Twitter @nickcawley1