
Talking Points:
- Chinese manufacturing PMI at 50.3 versus 51.1 expected, weakest since 2016
- The Lunar New Year was said to have negatively impacted the official figures
- A bearish continuation pattern on a daily AUD/USD chart? Will it keep falling?
Find out what the #1 mistake that traders make is and how you can fix it!
The Australian Dollar took a hit, though gave back some of its losses, immediately after we received a snapshot of China’s manufacturing sector. In February, the official PMI reading was 50.3 versus 51.1 expected and 51.3 in January. This was the slowest pace of expansion since July 2016. Keep in mind, a reading above 50 indicates growth while those below show contraction.
Non-manufacturing PMI came out at 54.4 from 55.3 prior. This was also below estimates of 55.0. According to the Federation of Logistics and Purchasing, the fall in these readings was due to the Chinese New Year holiday. They expect the economy to resume stable operations soon after. After this was noted, AUD/USD pulled back a little.
The Australian Dollar often reacts to key economic news out of the world’s second largest economy. This is partly due to the fact that China is Australia’s largest trading partner. Economic news-flow from the former country often implies knock-on effects on the latter.
Even so, the Reserve bank of Australia has shown us that they are in no rush to raise rates any time soon. Overnight index swaps are now only pricing in a 38.8% probability that the RBA will hike once by November, this has been falling from a peak of 78% confidence back in January. With that in mind, the sentiment-linked Australian Dollar will probability continue closely tracking the stock markets.

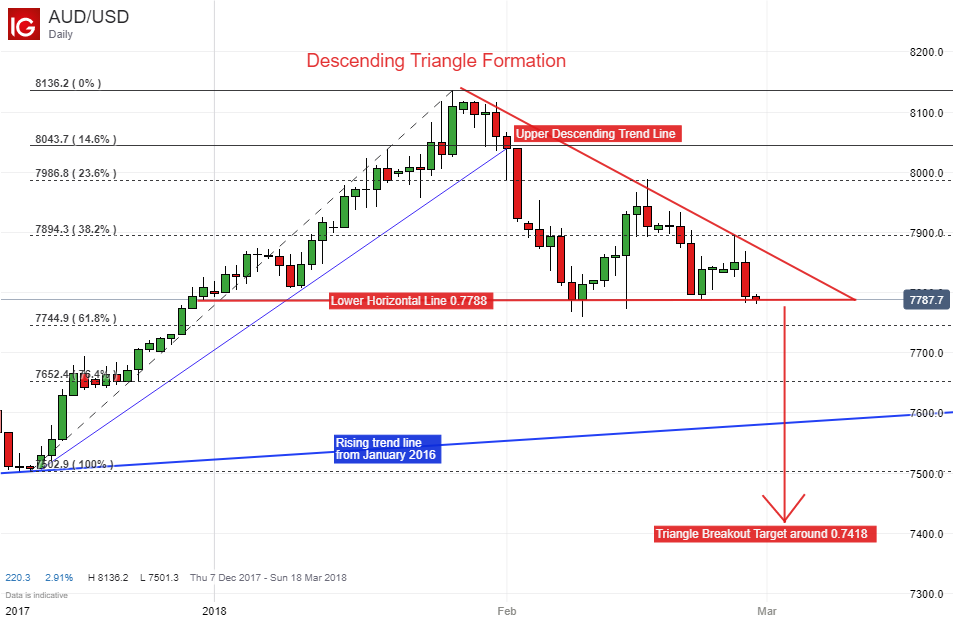
AUD/USD Technical Analysis: Descending Triangle?
On a daily chart, AUD/USD has formed what appears to be a descending triangle. This is a bearish formation pattern that usually implies continuation of a downtrend that is already in progress. In fact, the currency pair has been trending lower since late January.
The lower horizontal line of the descending triangle appears to be around 0.7788, and that is where AUD/USD currently finds itself testing once again. A break below the triangle would imply a target area around 0.7418. This is done by calculating the widest distance of the pattern and subtracting it from the horizontal line.
However, there are some obstacles if AUD/USD is indeed turning lower. Immediately below horizontal support are the 61.8% and 76.4% Fibonacci retracements at 0.7744 and 0.7652 respectfully. Beyond that is the rising trend line that goes back to January 2016.
On the other hand, should the currency pair start climbing again, the upper descending line of the triangle stands in the way as immediate resistance. A push above that exposes the 38.2% level at 0.7894 followed by the 23.6% area at 0.7986.