


Talking Points:
- Goldman Sachs lowers their 2015 WTI and Brent Crude price forecasts
- Copper trades 6 cents lower ; Canada exhibits economic signs of contraction
- USDCAD starts 2015 breaking 5 year highs
This week, analysts from leading global investment management firm, Goldman Sachs, lowered their 2015 WTI and Brent Crude forecasts. While Brent was slashed from $83.75 a barrel to $50.40, WTI was cut from $73.75 to $47.15 a barrel. The adjustments were driven largely by changes in global supply; storage capacity in the United States has increased as the Shale Revolution has favorably shifted the industry’s cost structure. Thus, as noted by the bank, prices per barrel could drop as low as $42 and $40.50 before embarking on a “U-shaped recovery”.
With facilities now capable of storing enough oil to supply 1 million barrels a day for a year, energy companies have renewed incentive to continue producing in advance of a time when prices do rise. Furthermore, because of its scalability shale has become less dependent on OPEC decisions and will thus hold investment until prices press even lower and drive investors out of the market. Such a prolonged excess in supply has thus further compounded the negative implications for major oil producers and non-energy markets.
As explained by Jeff Currie, global head of Commodities Research at Goldman Sachs, oil drives the US dollar which in-turn drives the price of non-energy markets—mining for metals is characterized by a higher variable cost which facilitates payment in local currencies. In taking this explanation the fall in the price of copper can potentially be explained; demand has diminished as the metal becomes relatively more expensive in USD terms. Thus, as a result of oil’s additional drop today Copper has traded as low as 2.699 after opening the day at 2.758. With the ratio of copper to oil prices falling a slowdown in economic growth among producers is likely to accompany it.
Such a slowdown is already presenting in Canada. Data released last week points to a 7.8% decline in November’s energy exports—the industry’s 6th consecutive monthly decrease. In an interview with Business News Network, Canadian Federal Finance Minister Joe Oliver estimates that the loss in federal revues, as a result of a fledging energy sector, will be upwards of 2.5 billion dollars. The impact however may prove graver to GDP as the newly forecasted levels sit well below the 60-70 dollar range indicated at the time of the bank's original assessments. Perhaps the first sign comes from Calgary-based oil and gas producer Canadian Natural Resource Ltd, which announced today a reduction in capital expenditure from $8.6 billion to$ 6.2 billion.
USD/CAD Monthly Chart
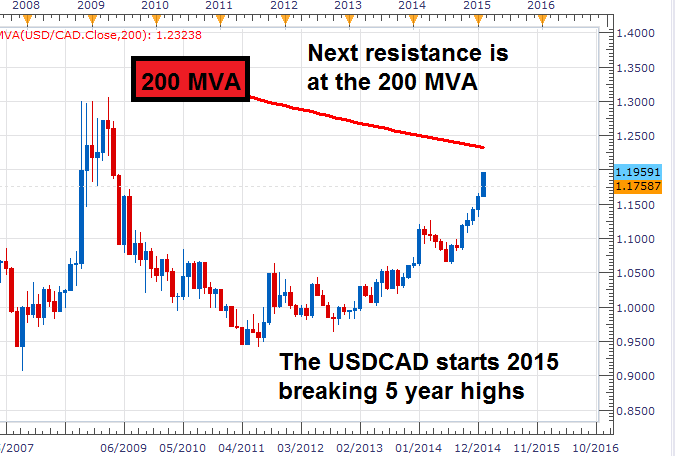
Chart Created by Walker England Using MarketScope2.0


