


US DOLLAR OUTLOOK: USD/JPY PRICE ACTION HITS 12-WEEK HIGH AHEAD OF NONFARM PAYROLLS DATA
- US Dollar strength has been relentless recently as the broader DXY Index gains another 0.4%
- USD/JPY extending its advance above the 105.00-price level to its highest level in 12-weeks
- USD/CAD overnight implied volatility elevated with nonfarm payrolls, Canadian jobs data due
- Learn more about the basics of technical analysis or implied volatility trading strategies
The US Dollar put in another strong session as bulls continue to fuel a rebound off multi-year lows. US Dollar buying pressure was most notable against the Euro and Yen on Thursday. EUR/USD price action was undermined by a breakdown of the 1.2000-level while USD/JPY extended its climb into the 105.00-handle.
| Change in | Longs | Shorts | OI |
| Daily | -2% | 2% | 0% |
| Weekly | 12% | -16% | -6% |
EUR/USD and USD/JPY are the two largest components of the DXY Index, which now trades about 1.8% higher year-to-date. Interestingly, US Dollar strength has persisted despite improving market sentiment and likely decrease in demand for safe-haven currencies that often corresponds with a falling VIX Index.
DXY – US DOLLAR INDEX PRICE CHART: DAILY TIME FRAME (11 AUG 2020 TO 04 FEB 2021)

Chart by @RichDvorakFX created using TradingView
This might speak to momentum behind the ongoing US Dollar rebound. The latest advance notched by the broader DXY Index appears to have eclipsed technical resistance posed by 91.10-price level and confirmed a breakout from the inverse head-and-shoulders chart pattern. As such, US Dollar bulls might be looking toward the 100-day simple moving average as a potential topside objective now.
The 92.15-price level, underpinned by the 31 August and 06 November swing lows, may also come into focus as prior support-turned-resistance. There could still be room for the US Dollar to move higher with the relative strength index hovering below ‘overbought’ territory, but it is worth noting how the upper Bollinger Band might keep upward advances relatively contained without width expansion.
USD PRICE OUTLOOK – US DOLLAR IMPLIED VOLATILITY TRADING RANGES (OVERNIGHT)
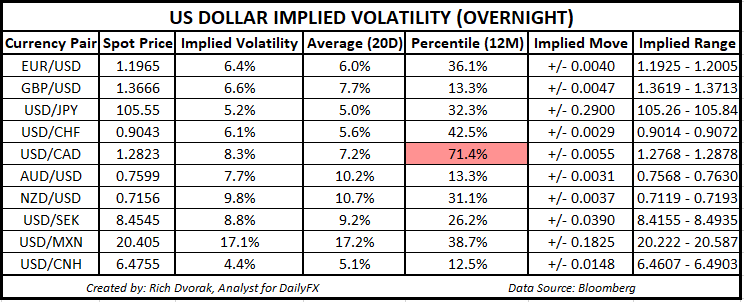
Even though we have high-impact event risk on deck surrounding the release of monthly jobs data, US Dollar volatility is expected to cool off judging by overnight US Dollar implied volatility readings across. USD/CAD price action could be one of the more active major currency pairs during Friday’s trading session, however.

This is gauging by USD/CAD overnight implied volatility reading of 8.3%, which is above its 20-day average reading of 7.2% and ranks in the top 70th percentile of measurements taken over the last 12-months. In addition to the nonfarm payrolls report release, Canadian employment data is due to cross market wires tomorrow, 05 February at 13:30 GMT as well.
-- Written by Rich Dvorak, Analyst for DailyFX.com
Connect with @RichDvorakFX on Twitter for real-time market insight


