


US Dollar Forecast Overview:
- The DXY Index has made little progress in recent days, and as a result, prices have begun to coil. But as the saying goes, “consolidations today lead to breakouts tomorrow.”
- Based on the Eurodollar contract spreads, there is exactly a 50% chance of a 25-bps rate cut by the end of the year – much less aggressive than Fed fund’s implied probability of 93%.
- Retail trader positioning suggests that the combination ofcurrent sentiment and recent changes gives us a further mixed USDJPY trading bias.
Looking for longer-term forecasts on the US Dollar? Check out the DailyFX Trading Guides.
All eyes are on Washington, D.C. this week as American and Chinese trade negotiators meet to end the US-China trade war. While news reports have already started to lower expectations for a broad, sweeping agreement, price action across various asset classes – bonds, commodities, stocks, FX – suggest that traders are still holding out hope for an ‘olive branch’ between the world’s two largest economies.
But before any significant trade developments are revealed, market participants will need to content with Federal Reserve Chair Jerome Powell and the September FOMC meeting minutes. Comments in recent days seem to suggest that the Fed rate cycle will cut deeper than previously envisioned.
US Treasury Yield Curve Remains Ominous
Yet despite investors proving resilient in an environment proving increasingly hazardous, there are still many reasons why sentiment and rate expectations could turn on a dime. Even as US economic data has improved in recent weeks – the Citi Economic Surprise Index for the US is currently 19, up from -46.8 three months ago on July 10 – the US Treasury yield curve continues to suggest that traders are concerned about the state of global growth.
US Treasury Yield Curve: 1-month to 30-years (October 9, 2019) (Chart 1)
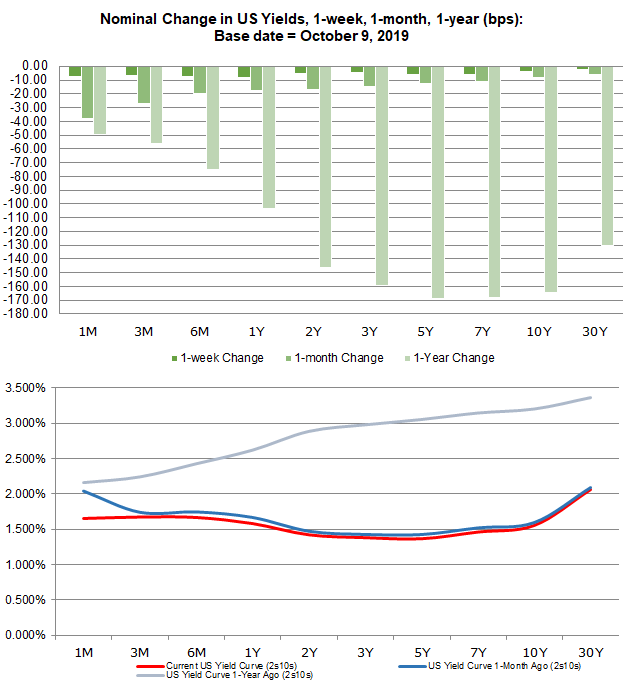
It still holds that the drop in both short-end and long-end rates suggest that investors’ expectations for the Fed’s rate cut cycle have been pulled forward over the past week. Given that the US Treasury yield curve is roughly in the same shape as it was one month ago, it can be implied that markets are still pricing in similar US recession odds.
Fed Rate Cut Cycle Looking Very Dovish
There is now an 80% chance of a 25-bps interest rate cut at the October Fed meeting, according to Fed funds futures. If not, there is a 93% chance of the rate cut coming at the December Fed meeting. But if the Fed does indeed cut rates in October, then rates markets are pricing in a 53% chance of another 25-bps rate cut by the end of the year.
Federal Reserve Interest Rate Expectations (October 9, 2019) (Table 1)
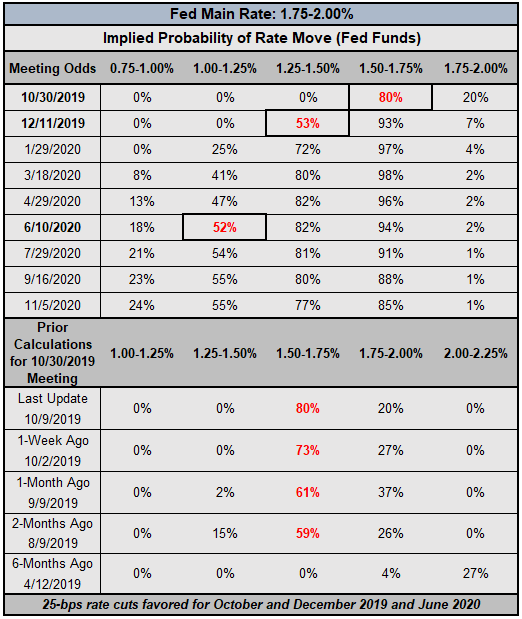
Yesterday, there was an 81% chance of a 25-bps rate cut at the October Fed meeting; one week ago, those odds were 73%; and one month ago, those odds were 61%. While the trajectory has been for a more dovish Fed, it is worth noting that one month ago, there was a 4% chance of a 50-bps rate cut at the October Fed meeting; those odds are now down to 0%.
Eurodollar Contracts Concur with Fed Funds About Cut Cycle
We can measure whether a rate cut is being priced-in using Eurodollar contracts by examining the difference in borrowing costs for commercial banks over a specific time horizon in the future. Eurodollar contracts continue to be closely aligned with Fed funds regarding the scope and scale of the Fed rate cut cycle.
The chart below showcases the difference in borrowing costs – the spreads – for the continuous front month/January 20 (orange) and the continuous front month/June 20 (blue), in order to gauge where interest rates are headed in the December 2019 Fed meeting and the June 2020 Fed meeting.
Eurodollar Contract Spreads – Continuous Front Month/January 20 (Orange), Continuous Front Month/June 20 (Blue) (April 2019 to October 2019) (Chart 2)
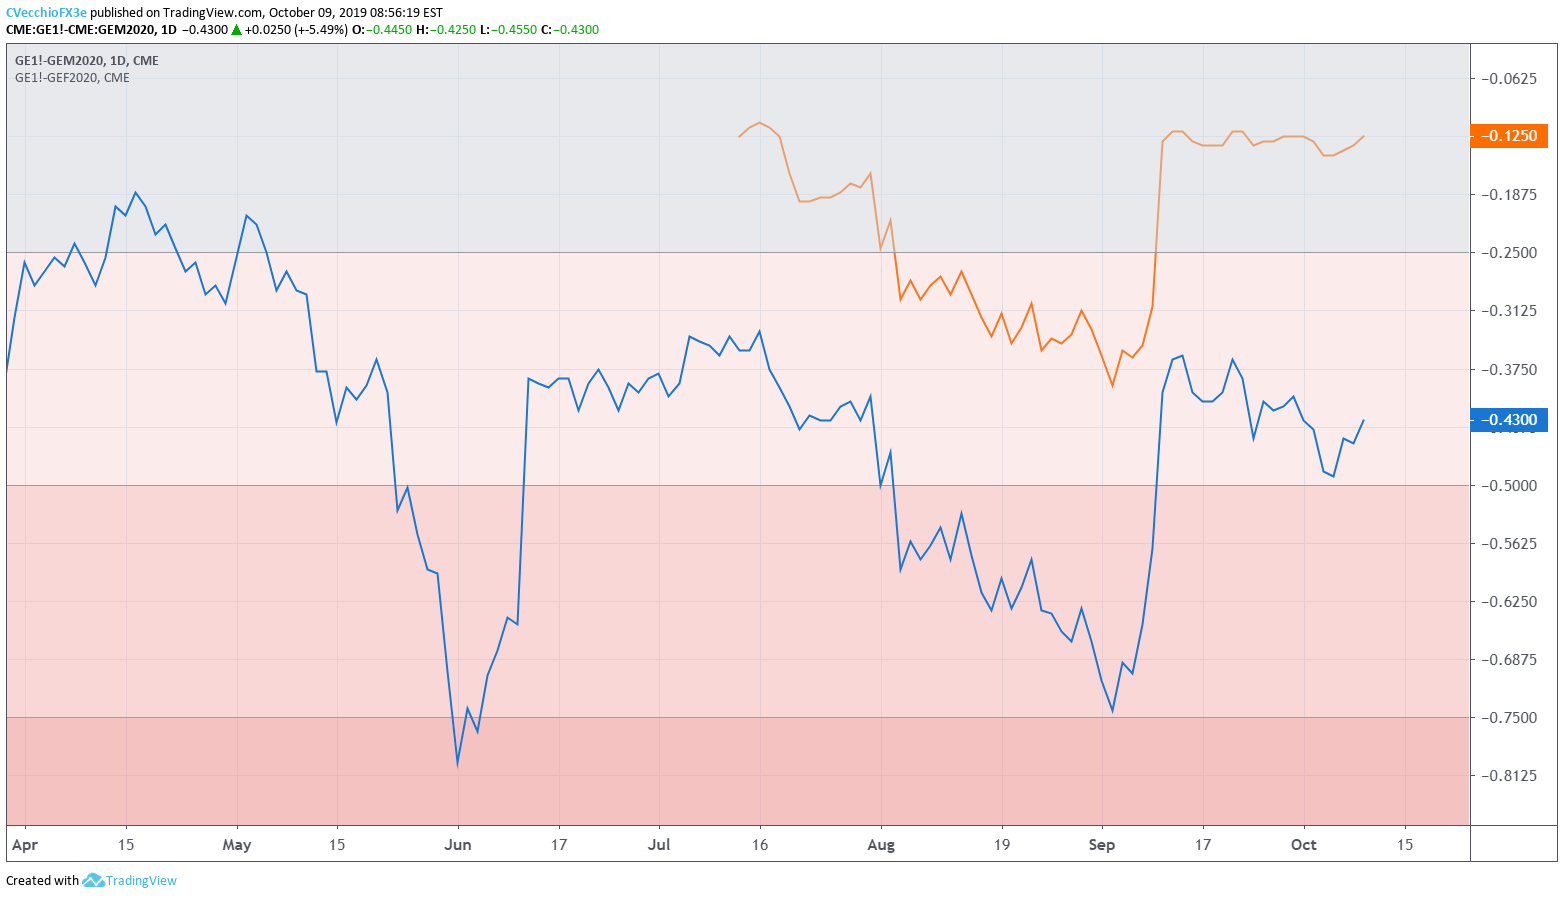
Based on the Eurodollar contract spreads, there is exactly a 50% chance of a 25-bps rate cut by the end of the year – much less aggressive than Fed fund’s implied probability of 93%. Through June 2020, Eurodollar contracts are pricing in a 72% chance of two 25-bps rate cuts; similarly, Fed funds are pricing in an 82% chance of two 25-bps by that point in time. Historically, wide gaps in rate expectations between Eurodollars and Fed funds leads to volatility in USD-pairs.
DXY PRICE INDEX TECHNICAL ANALYSIS: DAILY CHART (October 2018 to October 2019) (CHART 3)
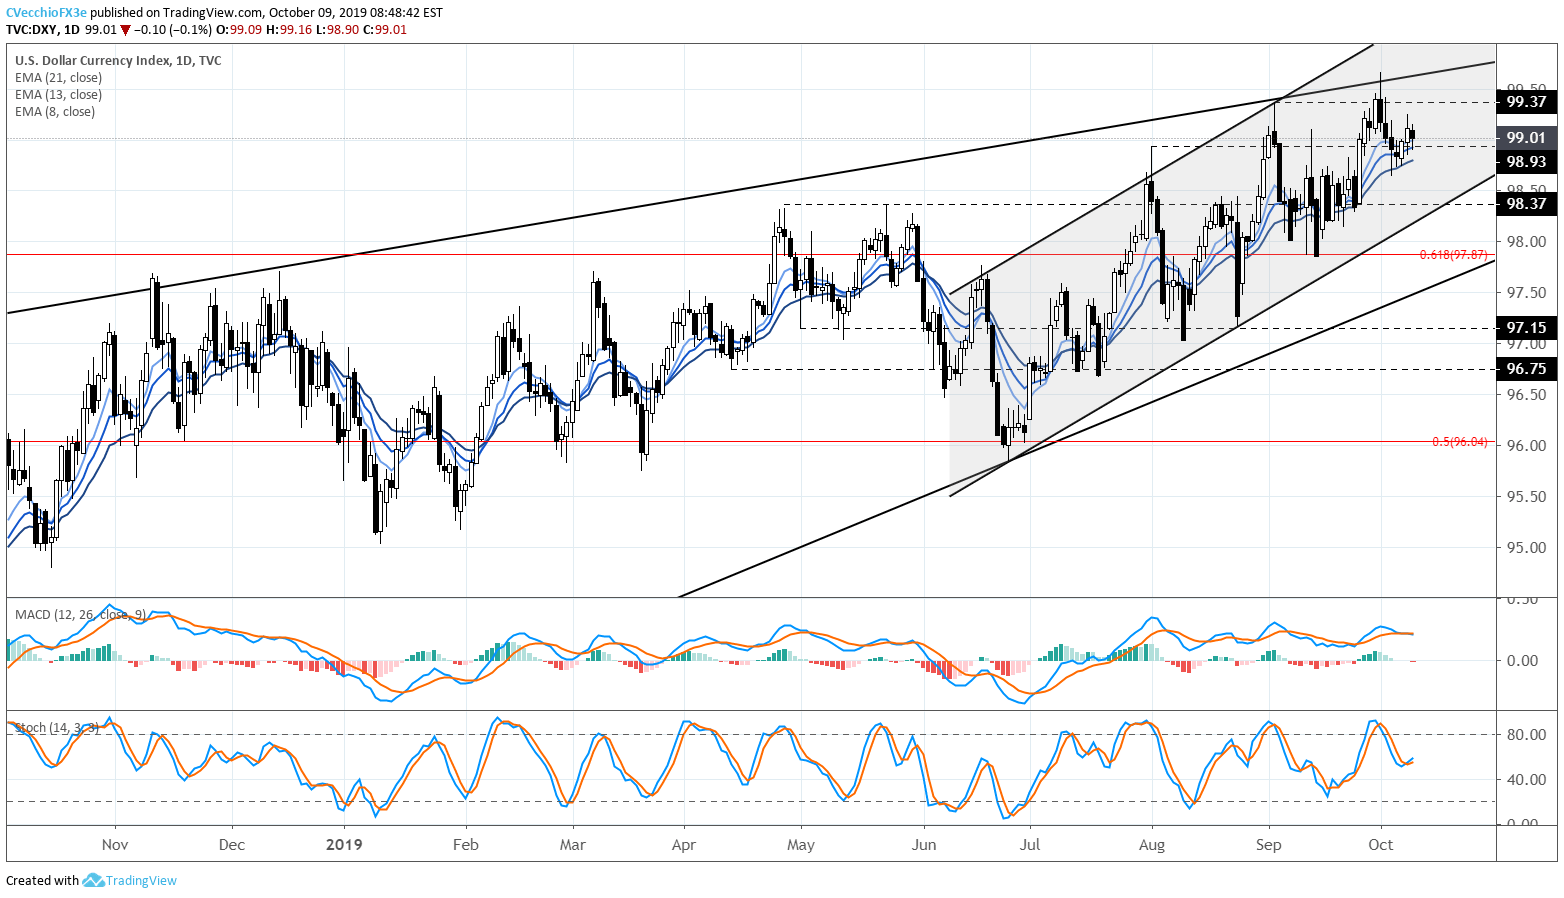
In our last DXY Index technical forecast update, it was noted that “further development is needed before a directional call can be made.” Unfortunately for traders, in the runup to the September FOMC meeting minutes, not much direction has been found by the US Dollar (via the DXY Index).
Last week, on October 1, the DXY Index pierced 99.37 on its way to a fresh yearly high of 99.67. But like on the first full trading days of August and September, the run to fresh yearly highs was marked by a bearish shooting star candle. To this end, the area where the DXY Index found resistance at the start of October was the trendline helping constitute resistance in the longer-term bearish rising wedge – an ominous topping pattern that persists.
For now, the DXY Index’s momentum profile remains neutral, if having a slightly bullish hue. Price is below the daily 8-EMA, but is trading above the daily 13- and 21-EMAs. Daily MACD has turned lower (albeit in bullish territory), while Slow Stochastics are hovering right around their median line. A close below the daily 21-EMA – not achieved since September 24 – may signal a greater likelihood of a turn lower.
USDJPY RATE TECHNICAL ANALYSIS: DAILY CHART (October 2018 to October 2019) (CHART 4)

In our last USDJPY rate technical forecast update, it was noted that “a move below the weekly low at 107.45 would suggest a false breakout has transpired in USDJPY…It appears that the latter scenario – a false bullish breakout – has started to play out.” Appearances can be deceiving, and once more, USDJPY rates find themselves trading back within the consolidation.
USDJPY rates are attempting to return above the late-September swing low and 76.4% retracement of the 2018 to 2019 high/low range near 106.78/97 as well as the descending trendline from the April 24 and July 10 swing highs. The daily 8-, 13-, and 21-EMA envelope is in bearish sequential order, but USDJPY is attempting to close above the daily 21-EMA today.
Daily MACD’s turn lower in bullish territory is waning prior to dipping below the signal line, while Slow Stochastics have rebounded before falling intooversold territory. Like the broader DXY Index, USDJPY rates need more development before a directional bias can be ascertained.
IG Client Sentiment Index: USDJPY RATE Forecast (October 9, 2019) (Chart 5)
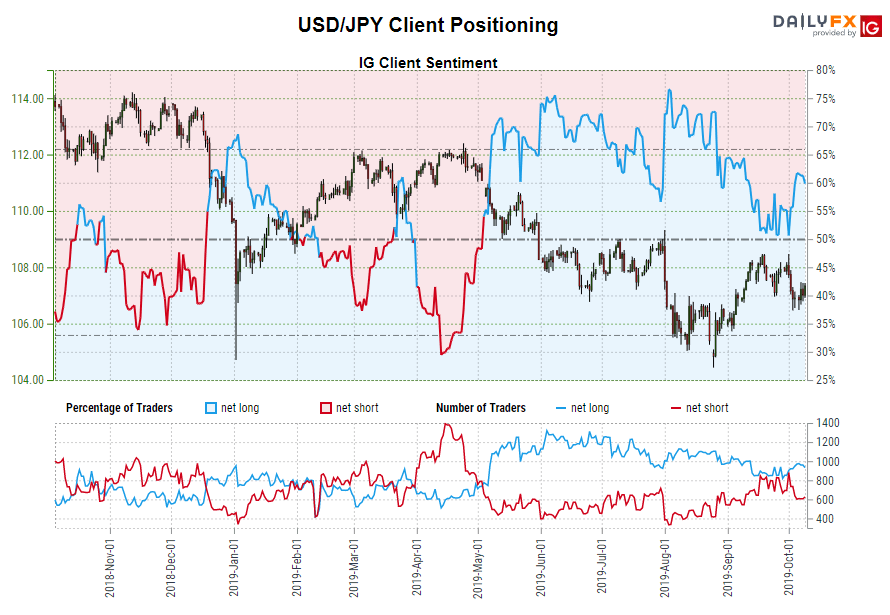
USDJPY: Retail trader data shows 56.1% of traders are net-long with the ratio of traders long to short at 1.28 to 1. In fact, traders have remained net-long since October 1 when USDJPY traded near 107.171; price has moved 0.2% higher since then. The number of traders net-long is 5.5% lower than yesterday and 6.3% higher from last week, while the number of traders net-short is 4.7% higher than yesterday and 10.9% lower from last week.
We typically take a contrarian view to crowd sentiment, and the fact traders are net-long suggests USDJPY prices may continue to fall. Positioning is less net-long than yesterday but more net-long from last week. The combination of current sentiment and recent changes gives us a further mixed USDJPY trading bias.
FX TRADING RESOURCES
Whether you are a new or experienced trader, DailyFX has multiple resources available to help you: an indicator for monitoring trader sentiment; quarterly trading forecasts; analytical and educational webinars held daily; trading guides to help you improve trading performance, and even one for those who are new to FX trading.
--- Written by Christopher Vecchio, CFA, Senior Currency Strategist
To contact Christopher Vecchio, e-mail at cvecchio@dailyfx.com
Follow him on Twitter at @CVecchioFX
View our long-term forecasts with the DailyFX Trading Guides


