


Canadian Dollar Talking Points
USD/CAD snaps the range bound price action from the previous week even though Bank of Canada (BoC) Governor Tiff Macklem rules out a V-shape recovery, and the reversal from the March low (1.3315) may continue to unravel as the Relative Strength Index (RSI) fails to break out of the bearish formation carried over from the previous month.
USD/CAD Reversal from March Low Unravels as RSI Retains Bearish Trend
USD/CAD continues to pullback from the monthly high (1.3686) as BoC Governor Macklem reiterates that “the policy rate is now at its effective lower bound,” with the new central bank head pledging to carry out “large-scale asset purchases until the economic recovery is well underway.”
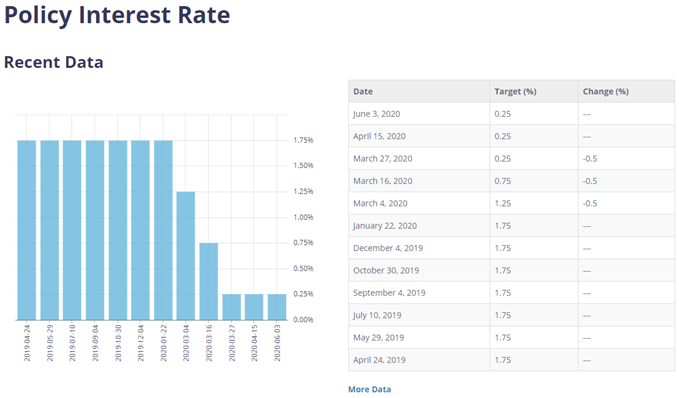
Source: BoC
The comments suggest the BoC will retain a dovish forward guidance as “the quick rebound of the reopening phase of the recovery will give way to a more gradual recuperation phase,” and the central bank may come under pressure to deploy more non-standard tools as Governor Macklem warns that “the recovery will likely be prolonged and bumpy, with the potential for setbacks along the way.”
However, Governor Macklem insists that “any further policy actions would be calibrated to provide the necessary degree of monetary policy accommodation required to achieve the inflation target,” and it remains to be seen if the BoC will further utilize its balance sheet over the coming months as officials “expect growth to resume in the third quarter.”
In turn, the BoC may stick to the sidelines at the next meeting on July 15 as “the government’s fiscal measures have been scaled to replace the labour income lost throughout the economy, laying the foundation for recovery,” and the update to the Monetary Policy Report (MPR) may reveal a shift in the forward guidance for monetary policy as “the Bank is reducing the frequency of its term repo operations to once per week, and its program to purchase bankers’ acceptances to bi-weekly operations.”
Until then, USD/CAD may face range bound conditions as the reversal from the March low (1.3315) stalls ahead of the June high (1.3801), while the Relative Strength Index (RSI) fails to break out of the bearish formation carried over from the previous month.

Sign up and join DailyFX Currency Strategist David Song LIVE for an opportunity to discuss potential trade setups.
USD/CAD Rate Daily Chart
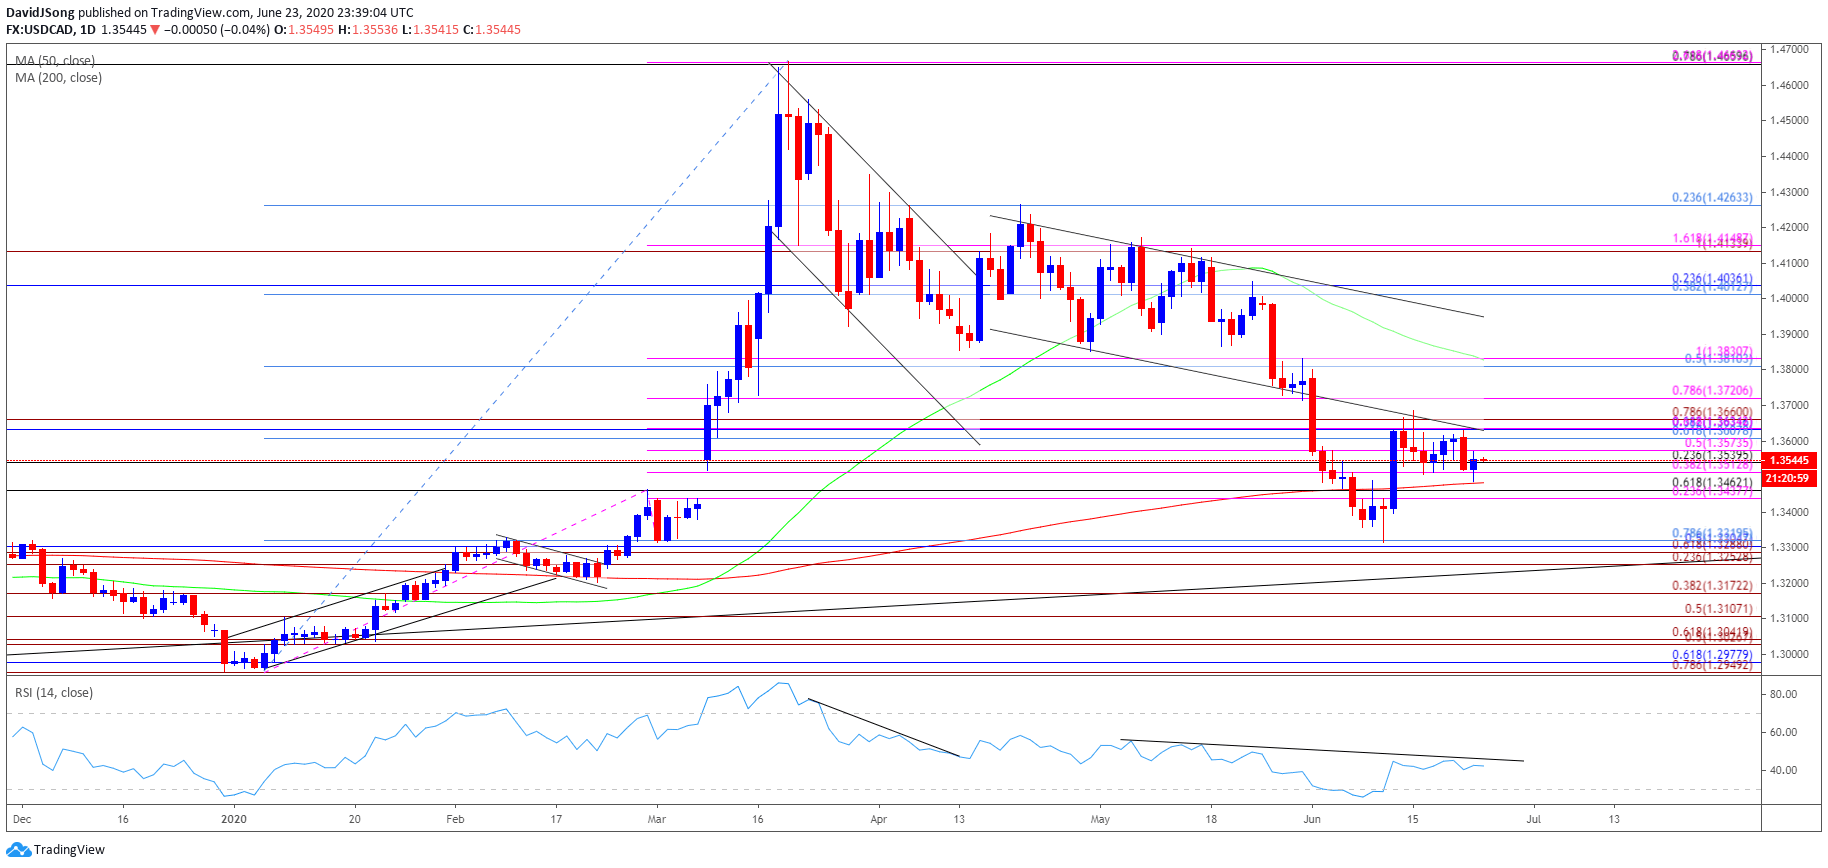
Source: Trading View
- Keep in mind, the near-term rally in USD/CAD emerged following the failed attempt to break/close belowthe Fibonacci overlap around 1.2950 (78.6% expansion) to 1.2980 (61.8% retracement), with the yearly opening range highlighting a similar dynamic as the exchange rate failed to test the 2019 low (1.2952) during the first full week of January.
- The shift in USD/CAD behavior may persist in 2020 as the exchange rate breaks out of the range bound price action from the fourth quarter of 2019 and clears the October high (1.3383).
- However, the pullback from the yearly high (1.4667) may continue to evolve as USD/CAD fills the price gap from March, with the Relative Strength Index (RSI) highlighting a similar dynamic as the oscillator continues to track the downward trend in May.
- Failure to test the monthly high (1.3801) has pushed USD/CAD back towards the Fibonacci overlap around 1.3510 (38.2% expansion) to 1.3540 (23.6% retracement), and the reversal from the March low (1.3315) may continue to unravel even though the RSI offered a textbook buy signal as the exchange rate snaps the range bound price action from the previous week.
- Need a close below the 1.3510 (38.2% expansion) to 1.3540 (23.6% retracement) region to open up the Fibonacci overlap around 1.3440 (23.6% expansion) to 1.3460 (61.8% retracement), with the next area of interest coming in around 1.3290 (61.8% expansion) to 1.3320 (78.6% retracement), which largely lines up with the June low (1.3315).

--- Written by David Song, Currency Strategist
Follow me on Twitter at @DavidJSong


