


Australian Dollar Talking Points
AUD/USD appears to be stuck in a narrow range amid the limited reaction to the Reserve Bank of Australia (RBA) Minutes, but the rebound from the yearly low (0.5506) may start to unravel as a bear flag formation continues to takes shape.
AUD/USD Bear Flag Continues to Take Shape Following RBA Minutes
AUD/USD continues to consolidate even though the RBA strikes a cautious tone and warns that “Australia would experience a very material contraction in economic activity, which would spread across the March and June quarters and potentially longer.”
The policy meeting minutes suggest that the RBA will rely on its unconventional tools to support the economy as “members had no appetite for negative interest rates,” but the statement offered little guidance as Governor Philip Lowe an Co. expect“a recovery once the COVID-19 outbreak has been contained.”
It remains to be seen if the RBA will continue to push monetary into uncharted territory as the central bank emphasizes that “the term funding scheme and the three-year bond yield target were both significant policy developments that would not have been under consideration in normal times,” and Governor Lowe and Co. may merely buy time at its next meeting on May 5 as officials pledge to purchase Australian government bonds for “as long as market conditions warrant.”
As a result, the RBA’s limited guidance for monetary policy may shore up AUD/USD amid the unprecedented steps to combat the economic shock, but the rebound from the yearly low (0.5506) may start to unravel as a bear flag takes shape, with the exchange rate initiating a fresh series of lower highs and lows.

Sign up and join DailyFX Currency Strategist David Song LIVE for an opportunity to discuss potential trade setups.
AUD/USD Rate Daily Chart
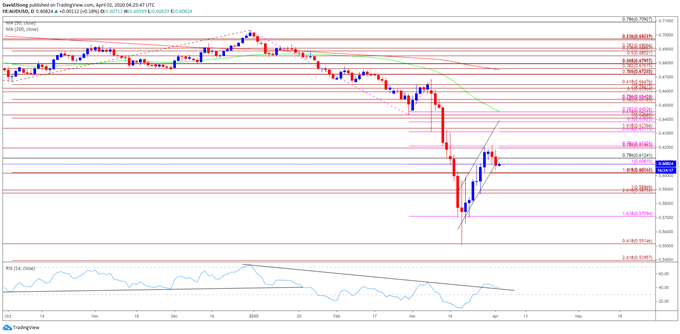
Source: Trading View
- Keep in mind, the monthly opening range has been a key dynamic for AUD/USD in the fourth quarter of 2019 as the exchange rate carved a major low on October 2, with the high for November occurring during the first full week of the month, while the low for December materialized on the first day of the month.
- The opening range for 2020 showed a similar scenario as AUD/USD marked the high of the month on January 2, with the exchange rate carving the February high during the first week of the month.
- However, the opening range for March was less relevant, with the high of the month occurring on the 9th, the same day as the flash crash.
- With that said, recent developments in the Relative Strength Index (RSI) warns of a potential shift in AUD/USD behavior as the oscillator bounces back from bounces back from oversold territory and breaks out of the bearish formation from earlier this year, but the recent recovery in the exchange rate may end up being short lived as a bear flag formation takes shape.
- AUD/USD appears to be stuck in a narrow range following the string of failed attempts to close above the Fibonacci overlap around 0.6190 (78.6% expansion) to 0.6210 (78.6% expansion), but the break of channel support along with the fresh series of lower highs and lows raises the scope for a further decline in the exchange rate.
- Need a break/close0.6020 (50% expansion) to bring the Fibonacci overlap around 0.5880 (261.8% expansion) to 0.5900 (100% expansion) on the radar, with the next region of interest coming in around 0.5710 (161.8% expansion).

--- Written by David Song, Currency Strategist
Follow me on Twitter at @DavidJSong


