


Gold Price Talking Points
The price of gold has marked a failed attempt to break out of the range-bound price action from the previous month, and developments coming out of the US may continue to influence the precious metal as the Federal Reserve starts to endorse a wait-and-see approach for monetary policy.
Gold Prices Stuck in October Range Following Upbeat ISM Survey
Gold gives back the advance following the Federal Reserve rate cut as the ISM Non-Manufacturing survey improves in October, with the index climbing to 54.7 from 52.6 in September.
At the same time, recent remarks from Fed officials indicate that the central bank will revert to a wait-and-see approach after reducing the benchmark interest rate for the third time in 2019 as the central bank believes “monetary policy is in a good place.”
Recent remarks from Dallas Fed President Robert Kaplan suggest the central bank will retain the current policy for the foreseeable future as the 2020 voting-member on the Federal Open Market Committee (FOMC) insists that the current stance of monetary policy is “mildly accommodative.”
In addition, Minneapolis Fed President Neel Kashkari, who also votes on the FOMC in 2020, argues that “interest rates are now around neutral, or modestly accommodative,” and it seems as though the central bank is on track to retain the current policy at the next interest rate decision on December 11 especially as the US and China look to sign “phase one” of the trade deal over the coming days.
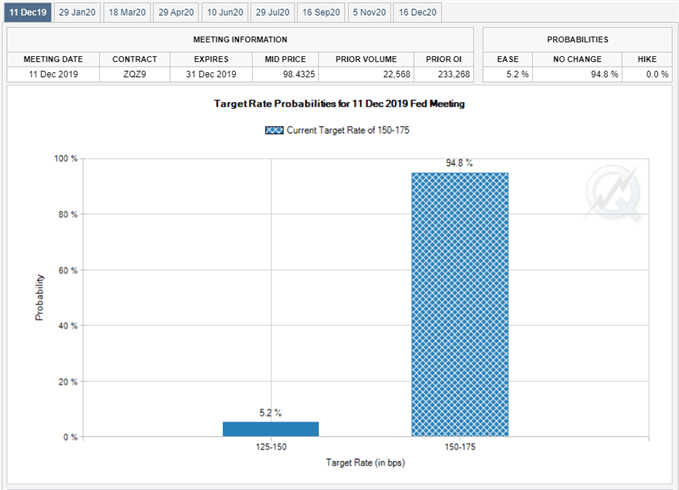
In fact, Fed Fund futures show a greater than 90% probability for the FOMC to keep the benchmark interest rate at 1.50% to 1.75% over the remainder of the year, but it remains to be seen if Fed officials will project a lower trajectory for the benchmark interest rate when the central bank updates the Summary of Economic Projections (SEP) in December amid the ongoing shift in US trade policy.
With that said, little indications for another Fed rate cut may continue to produce range-bound conditions for gold, with the near-term outlook still mired by a Head-and-Shoulders formation.
However, falling interest rates along with signs of a global recession may heighten the appeal of gold as market participants look to hedge against fiat currencies.
In turn, the price of gold may make further attempts to break out of the range bound price action carried over from the previous month as a bullish Flag formation takes shape.
Sign up and join DailyFX Currency Strategist David Song LIVE for an opportunity to discuss potential trade setups.
Gold Price Daily Chart
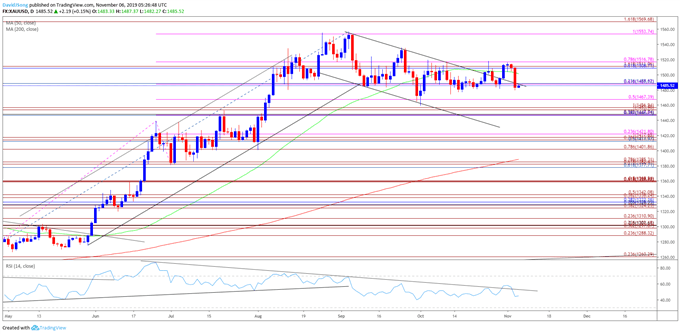
Source: Trading View
- The broader outlook for gold prices remain constructive as both price and the Relative Strength Index (RSI) clear the bearish trends from earlier this year, with the precious metal trading to a fresh yearly-high ($1557) in September.
- At the same time, recent developments in the RSI suggest the near-term correction in gold is coming to an end as the oscillator attempts to break out of the downward trend carried over from June.
- A bull flag formation continues to take shape amid the lack of momentum to test the Fibonacci overlap around $1447 (38.2% expansion) to $1457 (100% expansion), but need a break/close above the $1509 (61.8% retracement) to $1517 (78.6% expansion) region to bring the topside targets on the radar.
- First topside hurdle comes in around $1554 (100% expansion), which largely lines up with the yearly-high ($1557), followed by the $1570 (161.8% expansion) region.
For more in-depth analysis, check out the 4Q 2019 Forecast for Gold
Additional Trading Resources
Are you looking to improve your trading approach? Review the ‘Traits of a Successful Trader’ series on how to effectively use leverage along with other best practices that any trader can follow.
Want to know what other currency pairs the DailyFX team is watching? Download and review the Top Trading Opportunities for 2019.
--- Written by David Song, Currency Strategist
Follow me on Twitter at @DavidJSong.


