


Gold Price Talking Points
The price of gold breaks out of a narrow range on the back dismal data prints coming out of the US economy, and the failed attempt to test the monthly-low ($1459) may bring the topside targets back on the radar as a bull-flag formation takes shape.
Gold Price Forecast: Bull Flag to Negate Head-and-Shoulders Top
The near-term correction in gold appears to be coming to an end as the 1.1% decline in US Durable Goods Orders report puts increased pressure on the Federal Reserve to insulate the US economy.
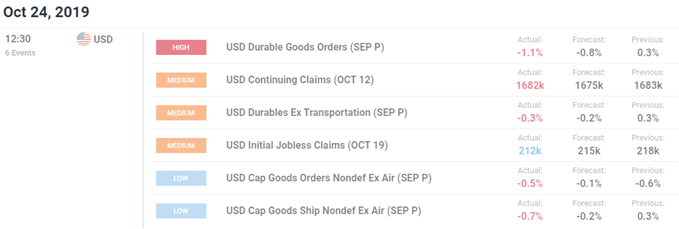
A deeper look at the report shows Non-Defense Capital Goods Orders excluding Aircrafts, a proxy for business investment, also narrowing 0.7% in September, and the slowdown in private-sector consumption may become a growing concern for the Federal Open Market Committee (FOMC) as household spending “has been the key driver of growth.”
In response, US President Donald Trump tweets that the “Fed was way too fast to raise, and way too slow to cut,” and the central bank may have little choice but to further embark on its rate easing cycle amid signs of a looming recession.
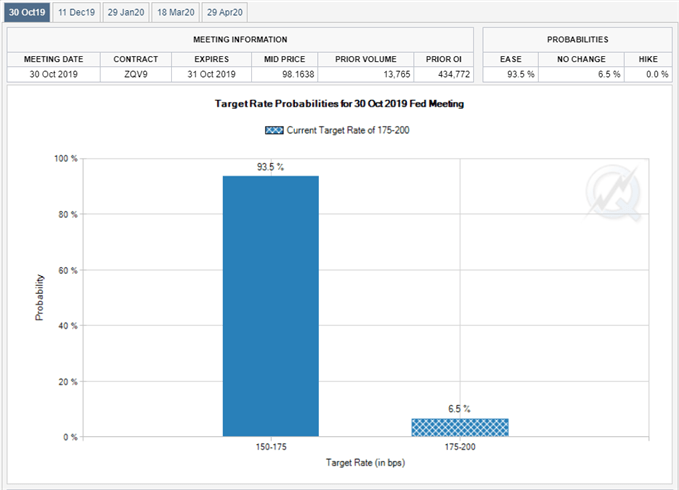
In turn, Fed Fund futures still show a greater than 90% probability for another 25bp reduction on October 30, and the central bank may continue to reverse the four rate-hikes from 2018 as “weakness in global growth and trade policy uncertainty haveweighed on the economy.”
However, the growing dissent within the FOMC may fuel fears of a policy error as the central bank makes an unexpected announcement to purchase US Treasury Bills in the secondary market, and it remains to be seen if Chairman Jerome Powell and Co. will project a lower trajectory for the benchmark interest rate as the US-China trade war appears to be coming to an end.
With that said, falling interest rates along with fears of a global recession may heighten the appeal of gold, and market participants may look to hedge against fiat currencies as the International Monetary Fund (IMF) continues to cut its growth forecast for the world economy.
Keep in mind, the near-term outlook for gold remains mired by a head-and-shoulders formation, but a bull-flag appears to be taking shape following the failed attempt to test the monthly-low ($1459).
Sign up and join DailyFX Currency Strategist David Song LIVE for an opportunity to discuss potential trade setups.
Gold Price Daily Chart
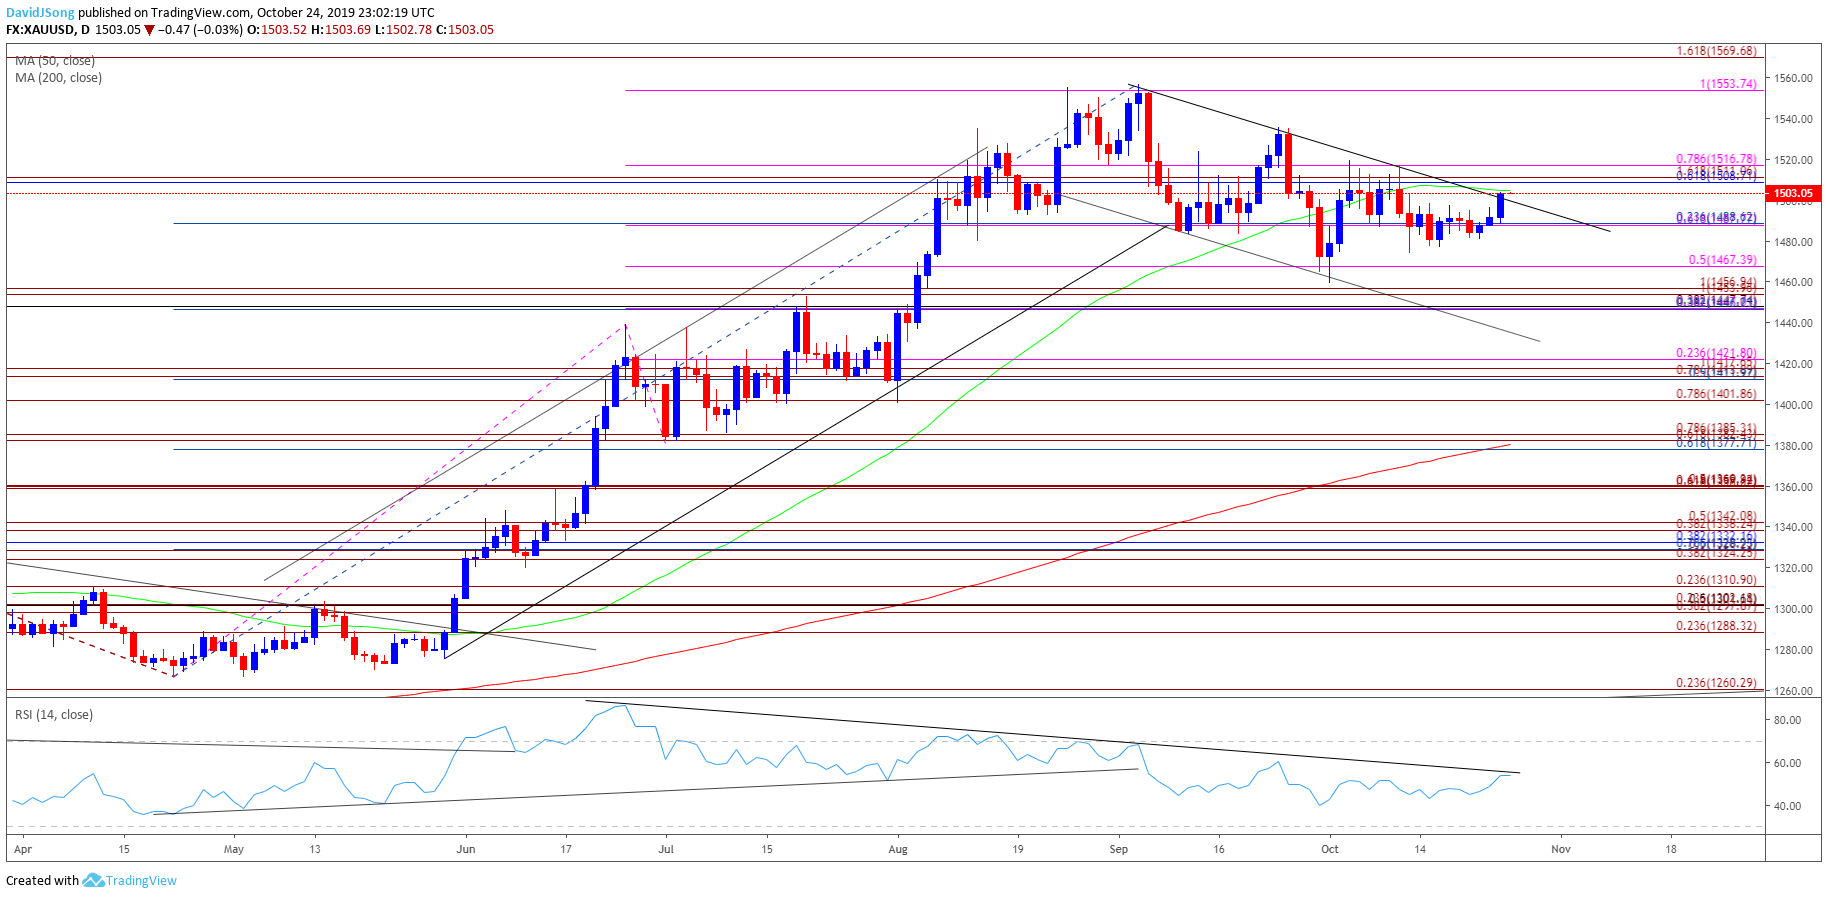
Source: Trading View
- The broader outlook for gold prices remain constructive as both price and the Relative Strength Index (RSI) clear the bearish trends from earlier this year, with the precious metal trading to a fresh yearly-high ($1557) in September.
- However, the RSI warns of a prolonged correction in gold as the oscillator continues to track the downward trend from June, with recent price action raising the risk for a head-and-shoulders top.
- The string of failed attempts to close above the Fibonacci overlap around $1509 (61.8% retracement) to $1517 (78.6% expansion) may produce range-bound conditions, but a bull-flag may continue to take shape as the price of gold preserves the monthly opening range.
- In turn, need the RSI to break out of the bearish formation to bring the topside targets back on the radar, with a close above the $1509 (61.8% retracement) to $1517 (78.6% expansion) region opening up the $1554 (100% expansion) area, which largely lines up with the 2019-high ($1557).
For more in-depth analysis, check out the 4Q 2019 Forecast for Gold
Additional Trading Resources
Are you looking to improve your trading approach? Review the ‘Traits of a Successful Trader’ series on how to effectively use leverage along with other best practices that any trader can follow.
Want to know what other currency pairs the DailyFX team is watching? Download and review the Top Trading Opportunities for 2019.
--- Written by David Song, Currency Strategist
Follow me on Twitter at @DavidJSong.


