


Gold Talking Points
The recent selloff in gold prices appear to have stalled ahead of the July 2017-low ($1205), with bullion at risk for a larger recovery as the Relative Strength Index (RSI) bounces back from oversold territory.
Gold Prices Stall Ahead of July 2017-Low But Sentiment Remains Extreme
Gold may stage a more meaningful rebound over the coming days as it snaps the series of lower lows from the previous week, but the broader outlook remains tilted to downside as both price and the RSI preserve the bearish formations from earlier this year.
At the same time, retail sentiment for gold remains stretched following the break of the December-low ($1236), with the IG Client Sentiment Report still showing 85.8% of traders net-long bullion compared to 86.1% last week.
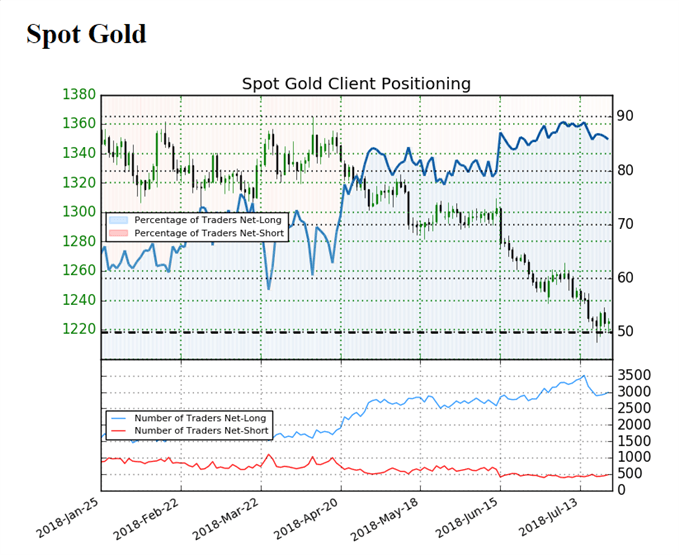
The number of traders net-long is 1.9% higher than yesterday and 15.0% lower from last week, while the number of traders net-short is 1.6% lower than yesterday and 7.2% higher from last week, with the ratio of traders long to short at 6.05 to 1. Despite the recent decline in net-long positions, the ongoing skew in retail positioning offers a contrarian view to crowd sentiment, with the persistent behavior highlighting a long-term bearish outlook for gold especially as the U.S. dollar appreciates on the back of the Federal Reserve’s hiking-cycle.
With that said, the downward trends in both price and the RSI may continue to evolve over the remainder of the year, but recent price action raises the risk for a larger rebound as the bearish momentum appears to be abating.
Gold Daily Chart
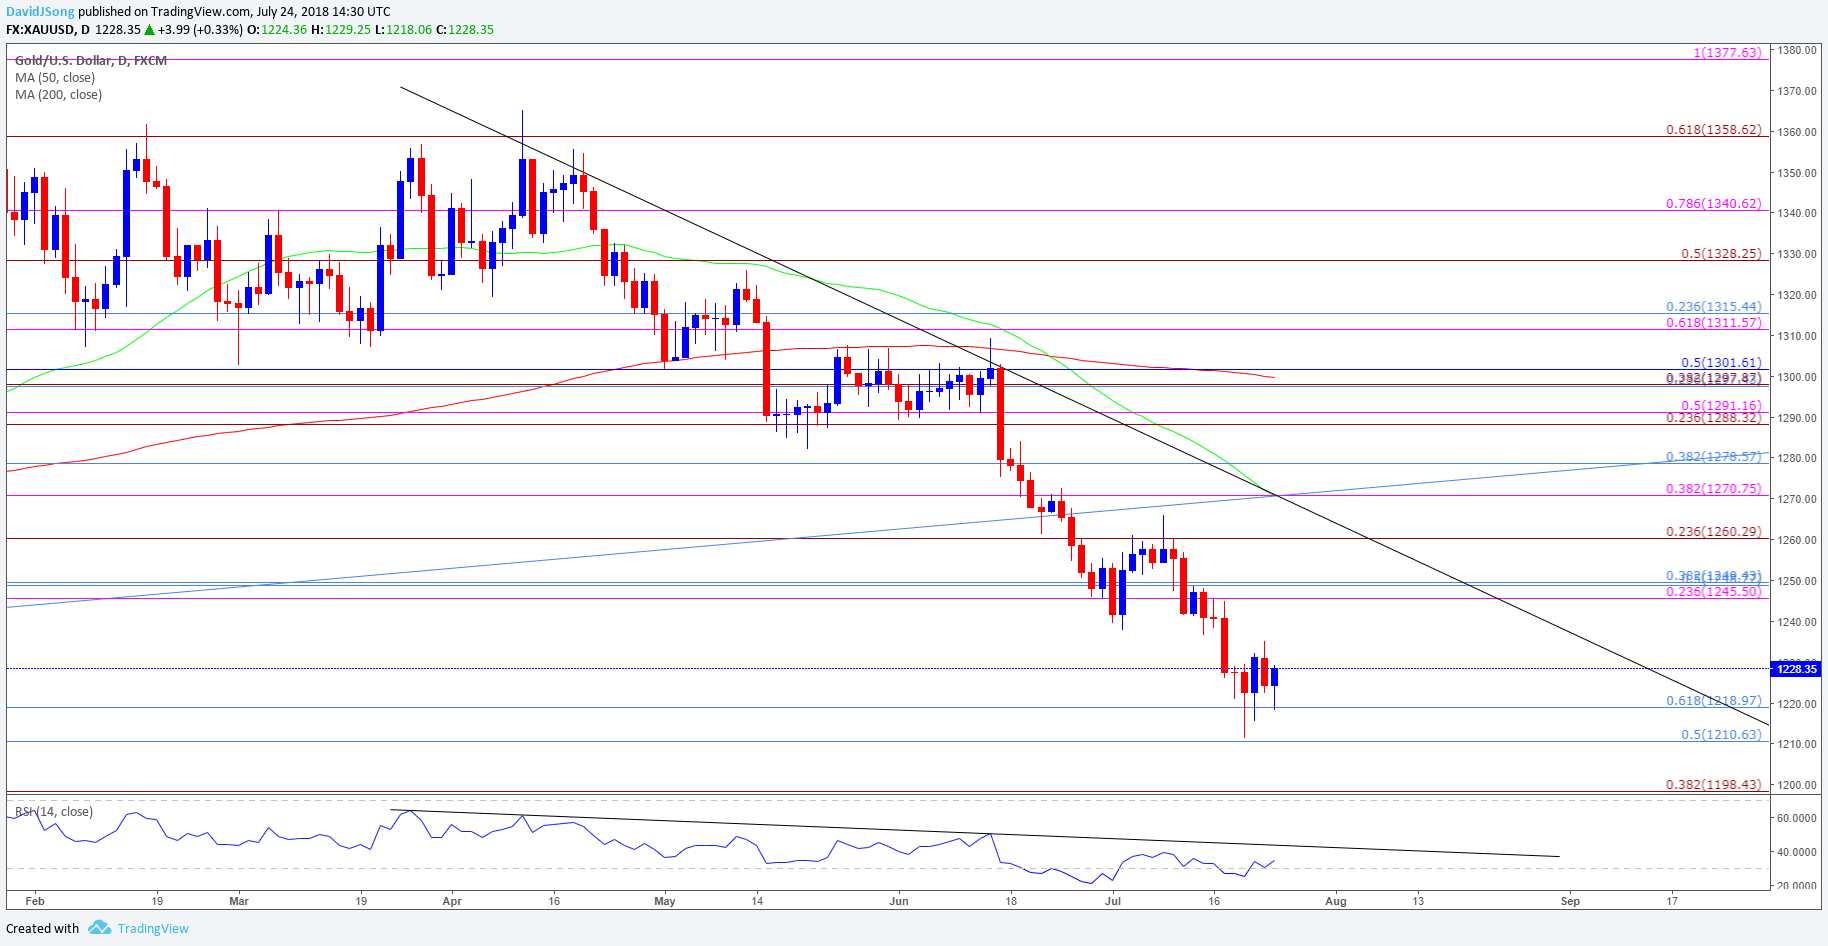
- The series of failed attempts to break/close below the $1210 (50% retracement) to $1219 (61.8% retracement) region may generate a larger rebound in bullion as the Fibonacci overlap offers support.
- In turn, gold prices stand at risk for a move back towards $1246 (23.6% expansion) to $1249 (38.2% retracement), with the next region of interest coming in around $1260 (23.6% expansion), which largely lines up with trendline resistance.
For more in-depth analysis, check out the Q3 Forecast for Gold
Interested in having a broader discussion on current market themes? Sign up and join DailyFX Currency Analyst David Song LIVE for an opportunity to discuss potential trade setups!
Additional Trading Resources
Are you looking to improve your trading approach? Review the ‘Traits of a Successful Trader’ series on how to effectively use leverage along with other best practices that any trader can follow.
Want to know what other currency pairs the DailyFX team is watching? Download and review the Top Trading Opportunities for 2018.
--- Written by David Song, Currency Analyst
Follow me on Twitter at @DavidJSong.


