


Japanese Yen Talking Points
USD/JPY is back under pressure following a slew of mixed data prints coming out of the U.S. economy, and the pair may continue to consolidate over the remainder of the week as the recent advance in the exchange rate fails to produce a test of the May-high (111.40).
USD/JPY Forecast: Failure to Test May-High to Fuel Larger Pullback
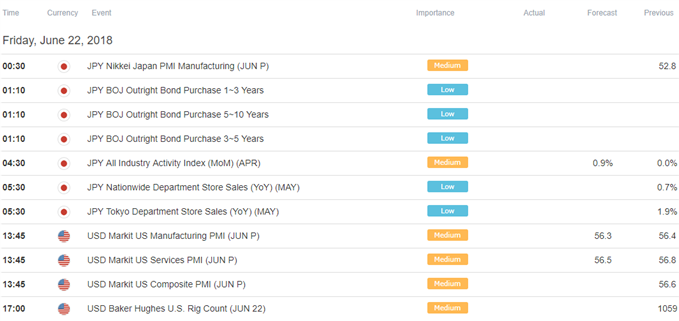
USD/JPY gives back the rebound from earlier this week as the Philadelphia Fed Business Confidence survey slips to 19.9 from 34.4 in May to mark the lowest reading since 2016, while a separate report showed U.S. Continuing Jobless Claims climbing to 1723K in the week ending June 9 amid forecasts for a 1710K print.
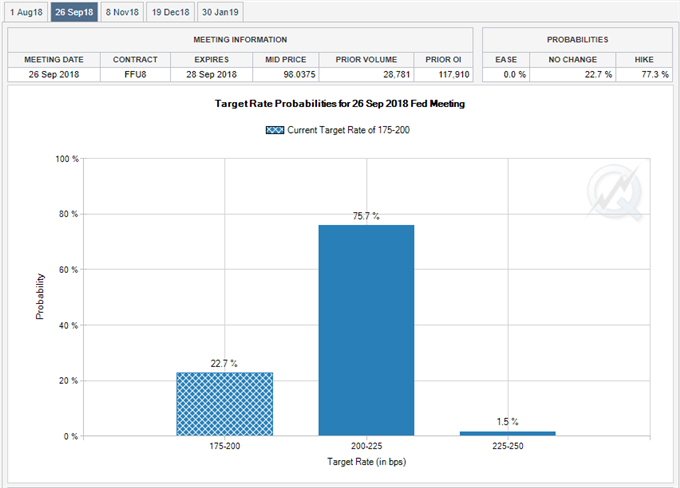
Even though the Federal Open Market Committee (FOMC) is widely anticipated to deliver another 25bp rate-hike in September, the reaction to the mixed data prints suggest the dollar remains vulnerable to near-term headwinds as signs of slowing activity curbs the central bank’s scope to adopt a more aggressive approach in normalizing monetary policy.
With that said, Chairman Jerome Powell and Co. may continue to project a longer-run Fed Funds rate of 2.75% to 3.00% as the committee pledges to ‘assess realized and expected economic conditions relative to its maximum employment objective and its symmetric 2 percent inflation objective,’ and market participants may put increased emphasis on the projections from Fed officials as the central bank pledges to phase out the forward guidance for monetary policy.
With that said, recent price action in USD/JPY raises the risk for a larger pullback as the pair sputters ahead of the May-high (111.40), and the Relative Strength Index (RSI) may exhibit a similar dynamic as the oscillator appears to be on course to threaten the bullish formation from earlier this year.
USD/JPY Daily Chart
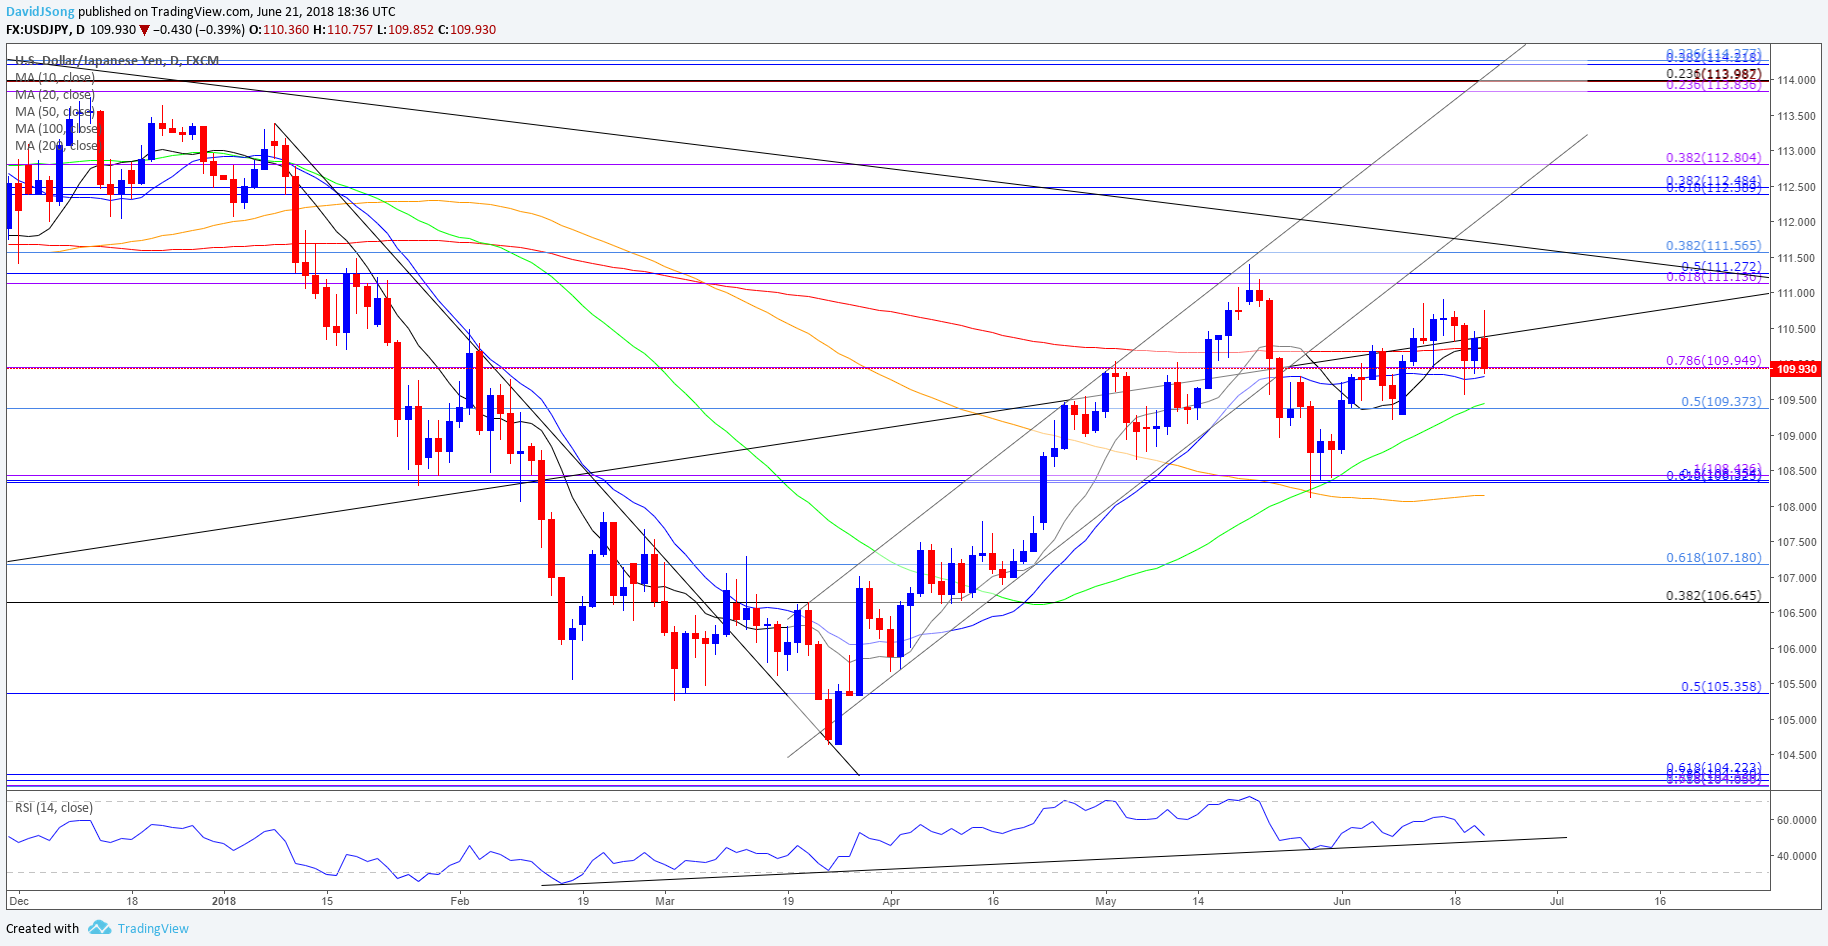
- The near-term advance in USD/JPY appears to be unraveling following the failed attempt to test the 111.10 (61.8% expansion) to 111.60 (38.2% retracement) region, with the RSI at risk of flashing a bearish trigger if the oscillator fails to react to trendline support.
- Break/close below the 109.40 (50% retracement) to 110.00 (78.6% expansion) region opens up the Fibonacci overlap around 108.30 (61.8% retracement) to 108.40 (100% expansion), with the next region of interest coming in around 106.70 (38.2% retracement) to 107.20 (61.8% retracement).
For more in-depth analysis, check out the Q2 Forecast for the Japanese Yen
Interested in having a broader discussion on current market themes? Sign up and join DailyFX Currency Analyst David Song LIVE for an opportunity to discuss potential trade setups!
Additional Trading Resources
Are you looking to improve your trading approach? Review the ‘Traits of a Successful Trader’ series on how to effectively use leverage along with other best practices that any trader can follow.
Want to know what other currency pairs the DailyFX team is watching? Download and review the Top Trading Opportunities for 2018.
--- Written by David Song, Currency Analyst
Follow me on Twitter at @DavidJSong.


