


Japanese Yen Talking Points
USD/JPY extends the decline from earlier this week as the escalating trade war between the United States and China drags on market sentiment, and recent price action raises the risk for a further decline in the exchange rate as it carves a fresh series of lower highs & lows.
USD/JPY Rate Carves Bearish Series Amid Escalating US-China Trade War
USD/JPY struggles to hold its ground as U.S. President Donald Trump threatens to tack on another $200B in tariffs on Chinese imports, and the shift in risk appetite may keep the dollar-yen exchange rate under pressures especially as China vows to ‘forcefully’ retaliate.
Even though the Federal Open Market Committee (FOMC) appears to be on course to implement four rate-hikes in 2018, the weakening outlook for global trade may limit the central bank’s scope to adopt a more aggressive in normalizing monetary policy as it dampens the outlook for growth and inflation. Signs of increased turmoil is likely to keep dollar-yen under pressure as it weighs on interest rate expectations, and Chairman Jerome Powell & Co. may continue project a longer-run Fed Funds rate of 2.75% to 3.00% as the committee pledges to ‘assess realized and expected economic conditions relative to its maximum employment objective and its symmetric 2 percent inflation objective.’
As a result, the advance from the May-low (108.11) may continue to unravel as USD/JPY carves a fresh series of lower highs & lows, with the Relative Strength Index (RSI) at risk of flashing a bearish signal as it comes up against trendline support.
USD/JPY Daily Chart
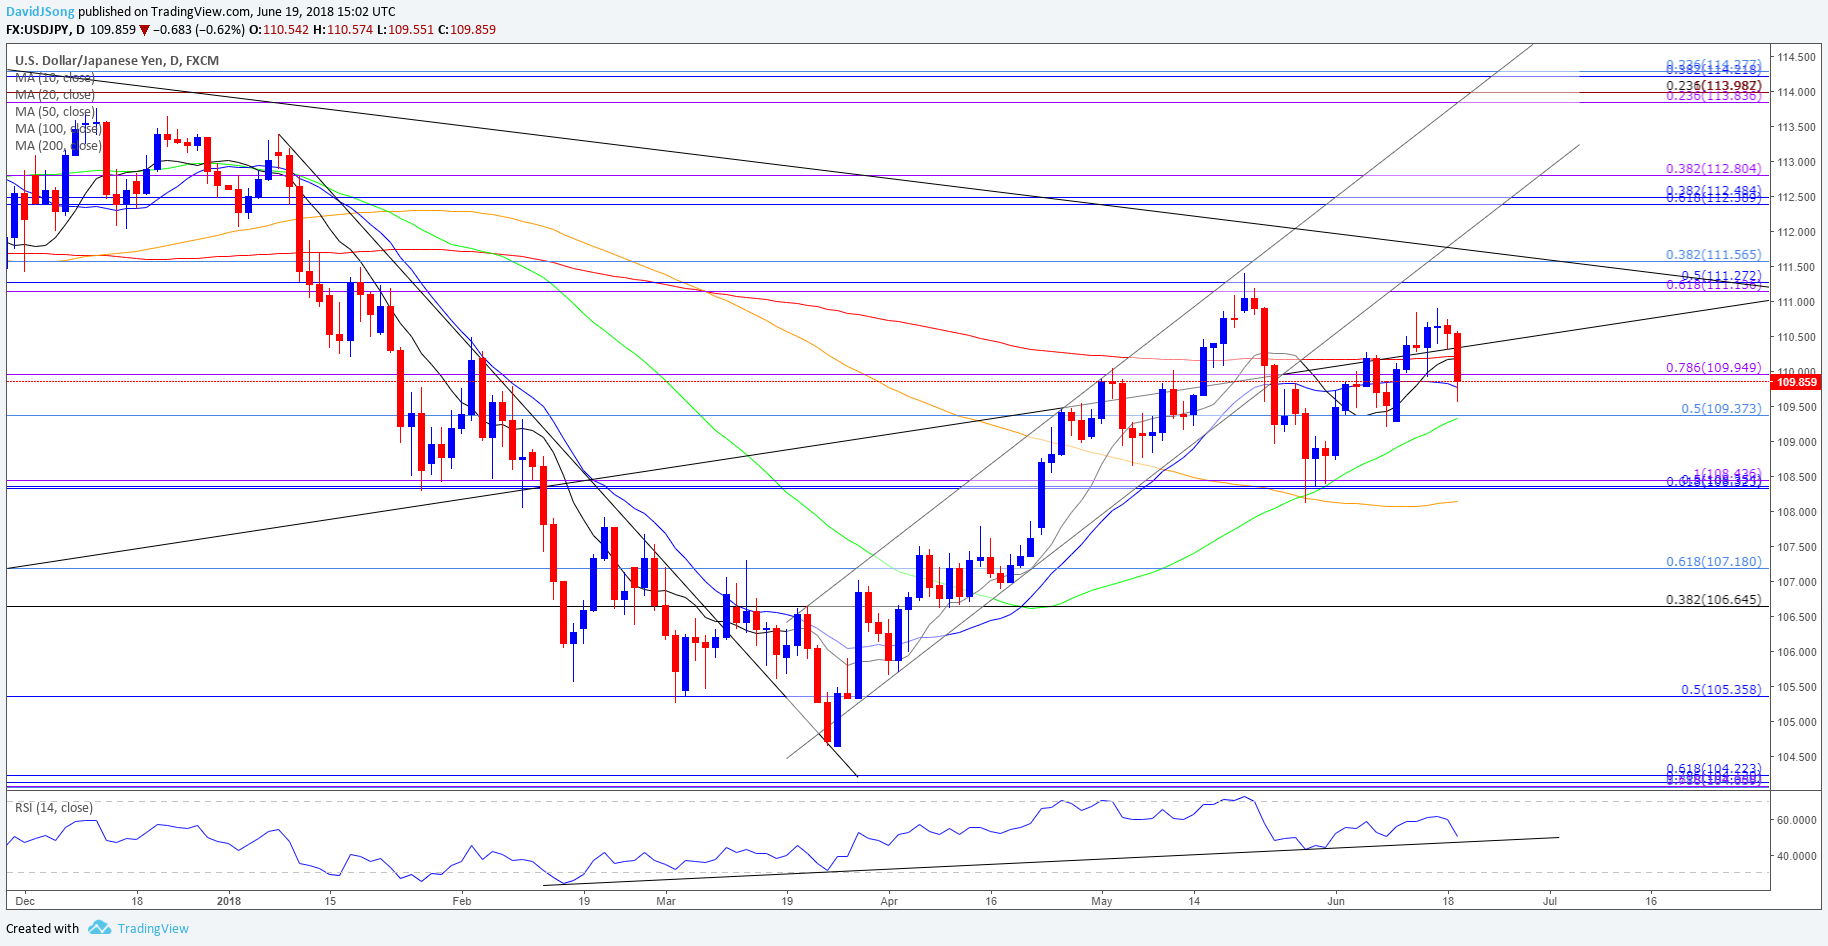
- Lack of momentum to test the May-high (111.40) raises the risk for a larger pullback in USD/JPY, with the RSI at risk of threatening the bullish formation from earlier this year as the oscillator approaches trendline support.
- Break/close below the 109.40 (50% retracement) to 110.00 (78.6% expansion) region opens up the Fibonacci overlap around 108.30 (61.8% retracement) to 108.40 (100% expansion), with the next region of interest coming in around 106.70 (38.2% retracement) to 107.20 (61.8% retracement).
For more in-depth analysis, check out the Q2 Forecast for the Japanese Yen
Interested in having a broader discussion on current market themes? Sign up and join DailyFX Currency Analyst David Song LIVE for an opportunity to discuss potential trade setups!
Additional Trading Resources
Are you looking to improve your trading approach? Review the ‘Traits of a Successful Trader’ series on how to effectively use leverage along with other best practices that any trader can follow.
Want to know what other currency pairs the DailyFX team is watching? Download and review the Top Trading Opportunities for 2018.
--- Written by David Song, Currency Analyst
Follow me on Twitter at @DavidJSong.


