


FX TALKING POINTS:
- EUR/USD Initiates Fresh Series of Higher Highs & Lows Ahead Euro-Zone Confidence Surveys. 2018-High (1.2556) on the Radar as Bullish Momentum Gathers Pace.
- USD/JPY Carves Bullish Outside-Day (Engulfing). Relative Strength Index (RSI) Divergence Takes Shape as Oscillator Holds Above Oversold Territory.
EUR/USD INITIATES FRESH SERIES OF HIGHER HIGHS & LOWS AHEAD EURO-ZONE CONFIDENCE SURVEYS. 2018-HIGH (1.2556) ON THE RADAR.
EUR/USD climbs to a fresh monthly-high (1.2462) during the last full-week of March, and the recent advance in the exchange rate may gather pace over the coming days as it initiates a fresh series of higher highs & lows.
EUR/USD appears to be on track to test the 2018-high (1.2556) as it breaks out of a tight range, but the slew of Euro-Zone confidence surveys may drag on the single-currency as household and businesses sentiment is expected to narrow in March. A slew of dismal developments may produce headwinds for the Euro as it encourages the European Central Bank (ECB) to further expand its balance sheet, and President Mario Draghi and Co. may continue to endorse a wait-and-see approach at the next meeting on April 26 as ‘domestic price pressures remain muted overall and have yet to show convincing signs of a sustained upward trend.’
However, the Governing Council may have little choice but to reveal a more detailed exit strategy as the quantitative easing (QE) program is set to expire in September, and a growing number of ECB officials may start to adopt a hawkish tone as ‘the latest data and survey results point to solid and broad-based growth momentum.’ With that said, the broader shift in EUR/USD may continue to take shape over the coming months as the ECB gradually adjusts the outlook for monetary policy.
EUR/USD DAILY CHART

- Near-term outlook for EUR/USD has perked up as a bullish series starts to take shape, with the Relative Strength Index (RSI) exhibiting a similar dynamic as it breaks out of the downward trend carried over from the previous month.
- Another close above 1.2430 (50% expansion) raises the risk for a run at the 2018-high (1.2556), with the next topside hurdle coming in around 1.2640 (61.8% expansion) to 1.2650 (38.2% retracement).
USD/JPY CARVES BULLISH OUTSIDE-DAY (ENGULFING). RELATIVE STRENGTH INDEX (RSI) DIVERGENCE TAKES SHAPE.
USD/JPY snaps back from a fresh 2018-low (104.63) despite the ongoing threat of a global trade war, and recent price action highlights the risk for a larger rebound as the dollar-yen exchange rate carves a bullish outside-day (engulfing) formation.
Keep in mind, USD/JPY may face choppy price action going into the end of the month as market participation is expected to narrow ahead of the Easter holiday, and fresh comments from Fed officials appear to be having a limited impact on the exchange rate even as Cleveland Fed President Loretta Mester, a 2018-voting member on the Federal Open Market Committee (FOMC), warns that ‘further gradual increases in interest rates will be appropriate this year and next year.’
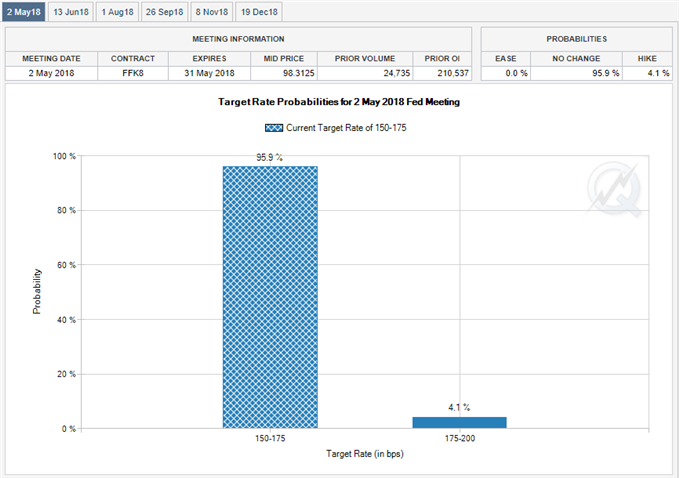
With that said, quarter/month-end flows may largely dictate price action across the FX market as the FOMC is widely expected to keep the benchmark interest rate on hold at the next meeting in May, and the USD/JPY selloff from the yearly-high (113.39) may continue to unravel over the coming days as the Relative Strength Index (RSI) starts to deviate with price.
USD/JPY DAILY CHART

- USD/JPY carves a bullish outside-day (engulfing) formation after failing to test the 104.10 (78.6% retracement) to 104.20 (61.8% retracement) region, with the pair at risk for a near-term correction especially as the Relative Strength Index (RSI) holds above oversold territory.
- Another close above 105.40 (50% retracement) raises the risk for a move back towards 106.70 (38.2% retracement) to 107.20 (61.8% retracement), with the next region of interest coming in around 108.30 (61.8% retracement) to 108.40 (100% expansion) followed by the Fibonacci overlap around 109.40 (50% retracement) to 110.00 (78.6% expansion).
Interested in having a broader discussion on current market themes? Sign up and join DailyFX Currency Analyst David Song LIVE for an opportunity to discuss potential trade setups!
Additional Trading Resources
Are you looking to improve your trading approach? Review the ‘Traits of a Successful Trader’ series on how to effectively use leverage along with other best practices that any trader can follow.
Want to know what other currency pairs the DailyFX team is watching? Download and review the Top Trading Opportunities for 2018.
--- Written by David Song, Currency Analyst
To contact David, e-mail dsong@dailyfx.com. Follow me on Twitter at @DavidJSong.
To be added to David's e-mail distribution list, please follow this link.


