


FX Talking Points:
- USD/JPY Weakness to Persist as Bearish Momentum Gathers Pace.
- AUD/USD Rate Rally Stalls Ahead of 2017-High; RSI Sell Signal on Tap.
USD/JPY remains under pressure even as the Bank of Japan (BoJ) sticks to its easing-cycle, with the pair at risk for further losses as the bearish momentum appears to be gathering pace.
Recent comments from Governor Haruhiko Kuroda suggest the BoJ is in no rush to wind down the Quantitative/Qualitative Easing (QQE) Program with Yield-Curve Control as the central bank pledges to expand the ‘monetary base until the year-on-year rate of increase in the observed CPI (all items less fresh food) exceeds 2 percent and stays above the target in a stable manner.’
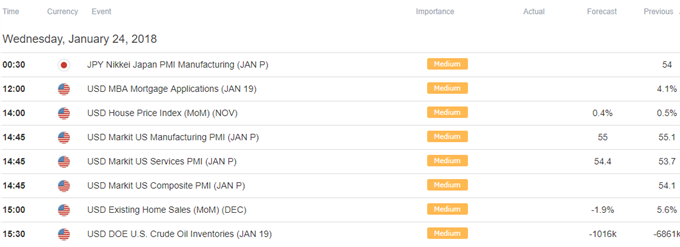
With the BoJ still on autopilot, key developments coming out of the U.S. economy may influence dollar-yen ahead of the Federal Reserve’s interest rate decision on January 31 as the central bank appears to be on course to further normalize monetary policy over the coming months.
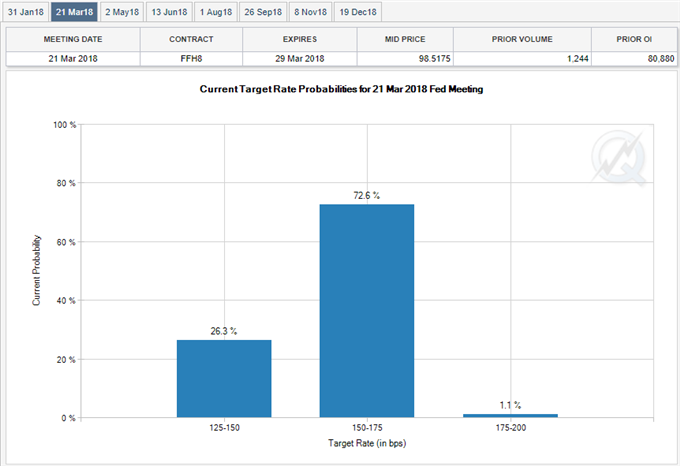
Keep in mind, Fed Fund Futures remain little changed from earlier this month, with market participants still pricing a greater than 70% probability for a March rate-hike, and lackluster developments coming out of the U.S. economy may continue to anchor interest rate expectations as the central bank struggles to achieve the 2% target for inflation.
In turn, downside targets remain on the radar for USD/JPY following the break of the descending triangle, with the pair at risk for further losses as the Relative Strength Index (RSI) continues to track the bearish formation carried over from the summer months. Want to know what other currency pairs the DailyFX team is watching? Download and review the Top Trading Opportunities for 2018.
USD/JPY Daily Chart

Interested in trading? Review the ‘Traits of a Successful Trader’ series on how to effectively use leverage along with other best practices that any trader can follow.
- Keeping a close eye on the RSI as it approaches oversold territory, with a break below 30 raising the risk for a further decline in USD/JPY as the bearish momentum gathers pace.
- Near-term outlook remains capped by the 111.10 (61.8% expansion) to 111.60 (38.2% retracement) region, with a break of the monthly-low (110.19) opening up the next downside hurdle around 109.40 (50% retracement) to 110.00 (78.6% expansion).
- Next area of interest comes in around 108.30 (61.8% retracement) to 108.40 (100% expansion) followed by the 2017-low (107.32), which sits above the Fibonacci overlap around 106.70 (38.2% retracement) to 107.20 (61.8% retracement).
The near-term advance in AUD/USD has started to show signs of exhaustion, with the string of failed attempts to test the 2017-high (0.8125) raising the risk for further losses as the Relative Strength Index (RSI) is on the cusp of flashing a textbook sell-signal.
The key release for Australia comes next week as the region is scheduled to update the Consumer Price Index (CPI), but recent developments in the RSI casts a cautious outlook for AUD/USD as the momentum indicator snaps the bullish formation from December and appears to be coming off of overbought territory.
The aussie-dollar exchange rate may highlight a similar dynamic as it comes up against trendline support, and AUD/USD may exhibit a more bearish behavior ahead of the Reserve Bank of Australia’s (RBA) February 6 meeting as the central bank is already expected to keep the cash rate at the record-low of 1.50%.
AUD/USD Daily Chart

Interested in having a broader discussion on current market themes? Sign up and join DailyFX Currency Analyst David Song LIVE for an opportunity to discuss potential trade setups!
- The rebound from the December-low (0.7501) may start to unravel following the failed attempts to close above the 0.8030 (38.2% expansion) hurdle.
- Need a break of trendline support/10-Day SMA (0.7952) paired with a break/close below the 0.7930 (50% retracement) to 0.7940 (61.8% retracement) region to bring the downside targets back on the radar for AUD/USD.
- Will also keep a close eye on the RSI as it falls back from the highs, with a move below 70 raising the risk for a further decline in AUD/USD as it flashes a textbook sell-signal.
- Next downside region of interest comes in around 0.7850 (38.2% retracement) to 0.7860 (61.8% expansion) followed by the Fibonacci overlap around 0.7720 (23.6% retracement) to 0.7770 (61.8% expansion).
Click Here for the DailyFX Calendar
--- Written by David Song, Currency Analyst
To contact David, e-mail dsong@dailyfx.com. Follow me on Twitter at @DavidJSong.
To be added to David's e-mail distribution list, please follow this link.


