


Talking Points:
- AUD/USD Winning Streak to Continue as Long as RSI Sits in Overbought Territory.
- EUR/USD Clings to Yearly Opening Range Ahead of FOMC Minutes.

AUD/USD marks its longest stretch of advances since September 2007, with the pair at risk of extending the recovery from the December-low (0.7501) as the bullish momentum appears to be gathering pace.
Near-term developments in the Relative Strength Index (RSI) alters the broader outlook for AUD/USD as the oscillator clears the bearish formation and pushes into overbought territory for the first time July, with the exchange rate at risk of highlighting a similar dynamic as it now threatens the downward trend carried over from September (AUD/USD Bullish RSI Trigger Remains in Focus Ahead of RBA Minutes).Key developments coming out of Australia may keep AUD/USD bid as the region’s trade balance surplus is expected to widen to A$500M from a$105M in October, but the Reserve Bank of Australia’s (RBA) wait-and-see approach for monetary policy may tame the recent appreciation in AUD/USD as Governor Philip Lowe & Co. remain in no rush to lift the cash rate off of the record-low.
In turn, AUD/USD may continue to gain ground ahead of the RBA’s first 2018 interest rate decision on February 6, with the near-term outlook still supportive for the pair as long as the momentum indicator holds above 70. Want to learn more about popular trading indicators and tools such as the RSI? Download and review the FREE DailyFX Advanced trading guides !
AUD/USD Daily Chart
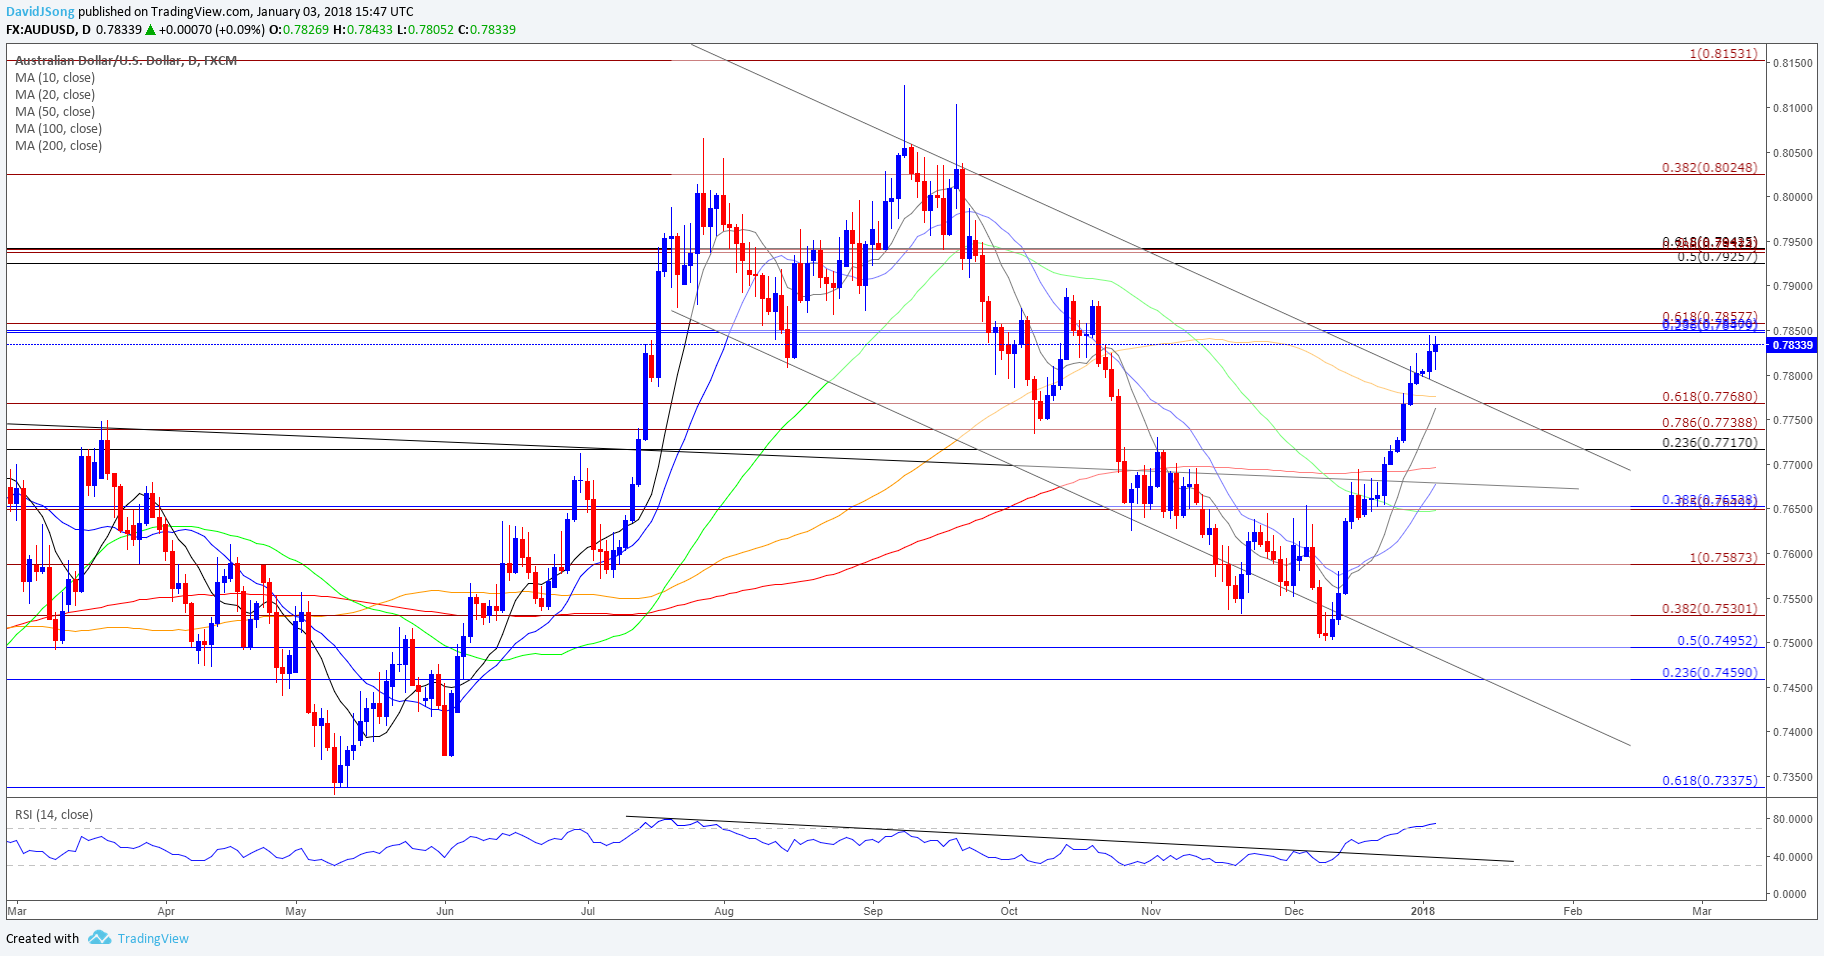
- Near-term outlook for AUD/USD remains constructive following the bullish RSI trigger, but the pair needs to break/close above the 0.7850 (38.2% retracement) to 0.7860 (61.8% expansion) zone to open up the next topside hurdle around 0.7930 (50% retracement) to 0.7940 (61.8% retracement).
- May see the 0.7650 (38.2% retracement) region continue to offer support as both price and the RSI threaten the bearish formations from the second-half of 2017, but the yearly opening range remains in focus as a near-term shift in AUD/USD behavior appears to be taking shape.
EUR/USD struggles to hold its ground as the ISM Manufacturing survey unexpectedly climbs to 59.7 from 58.2 in November, but the pair may cling to the yearly opening range ahead of the U.S. Non-Farm Payrolls (NFP) report as the fresh data prints coming out of the economy fail to boost bets for an imminent Fed rate-hike.
The failed attempt to test the September-high (1.2092) raises the risk for a near-term pullback in EUR/USD especially as the Relative Strength Index (RSI) struggles to hold above 70, and the rebound from the December-low (1.1718) may continue to unravel as the pair snaps the recent string of higher-lows.
A deeper look at the business sentiment survey showed the gauge for New Orders climbing to 69.4 from 64.0, with the index for factory-gate prices rebounding to 69.0 from 65.5 during the same period. However, the Employment component narrowed to 57.0 in December from 59.7 the month prior to mark the lowest reading since July, and the NFP report may also deliver a mixed message as Average Hourly Earnings are expected to hold flat at an annualized 2.5%.
Signs of subdued price pressures may undermine the Federal Open Market Committee’s (FOMC) scope to deliver three rate-hikes in 2018 as ‘inflation on a 12‑month basis is expected to remain somewhat below 2 percent in the near term,’ and the meeting minutes may offer little clues on the timing of the next policy action as ‘many participants observed that there was some likelihood that inflation might remain below 2 percent for longer than they currently expected.’ In turn, more of the same from the FOMC may keep EUR/USD afloat, with the broader outlook for the pair still supportive as both price and the RSI preserve the bullish formations carried over from November. Interested in having a broader discussion on current market themes? Sign up and join DailyFX Currency Analyst David Song LIVE for an opportunity to discuss potential trade setups!
EUR/USD Daily Chart
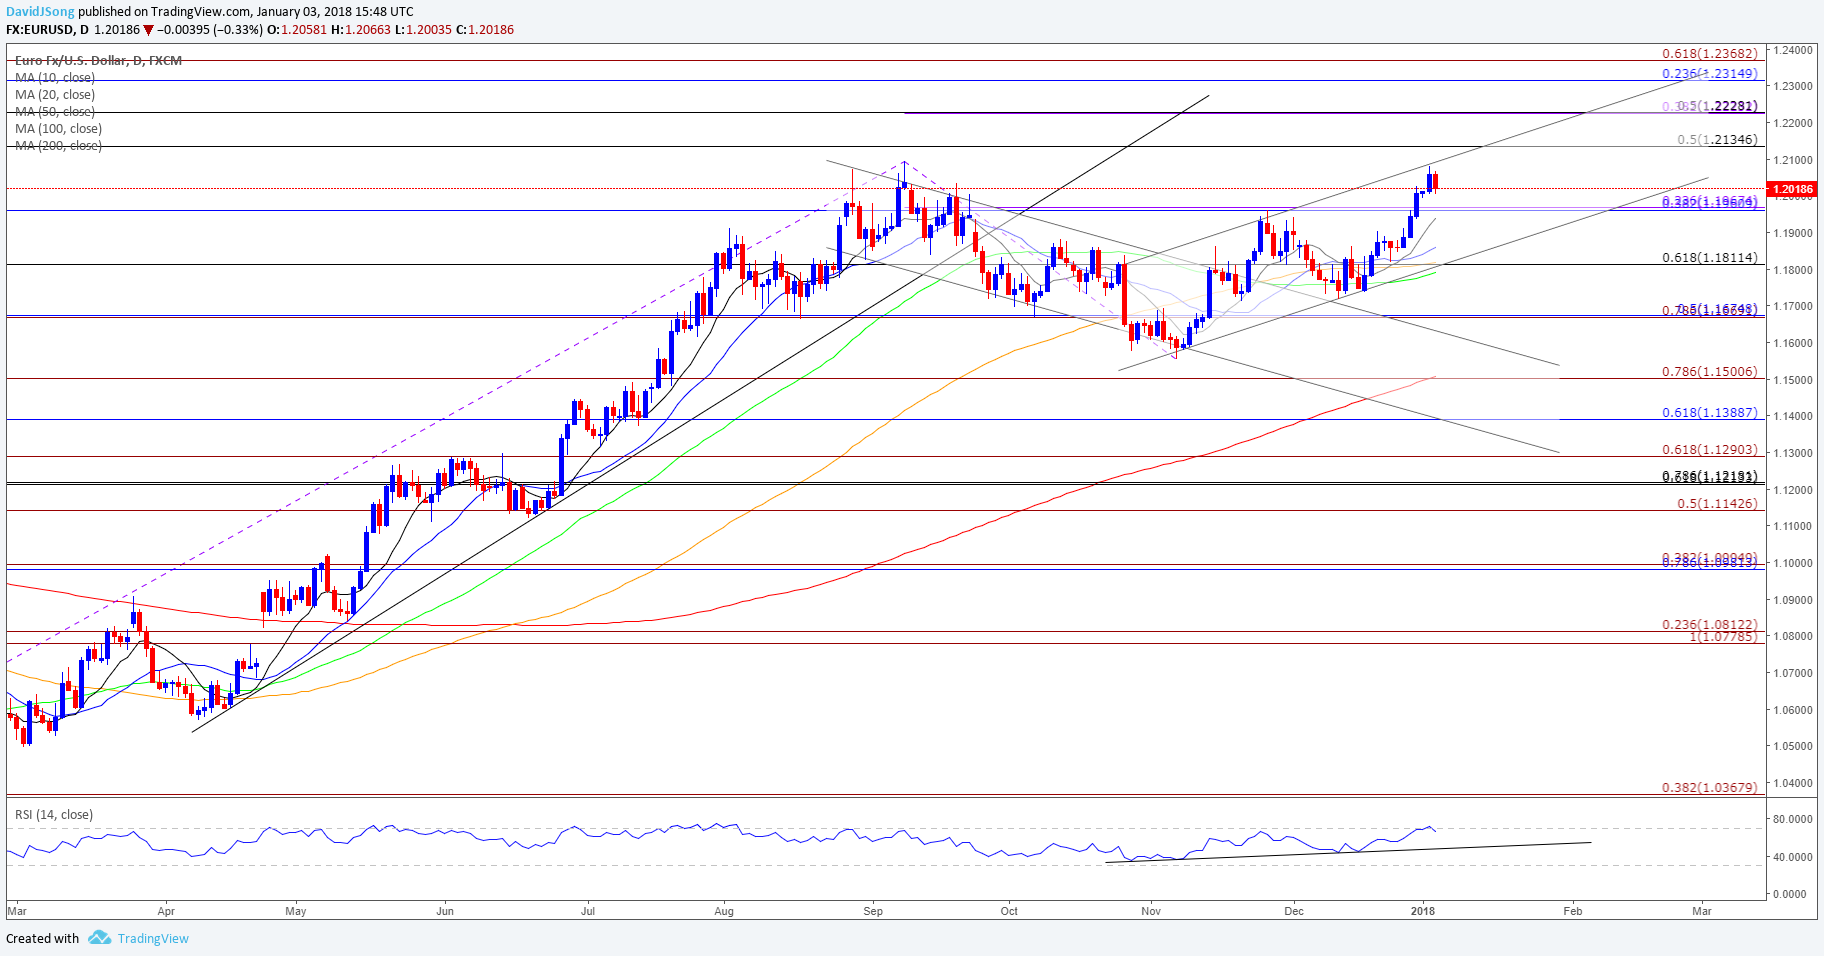
- May see EUR/USD face range-bound conditions following the failed attempt to test the September-high (1.2092), with the near-term outlook capped by the 1.2130 (50% retracement) hurdle.
- Topside targets remain on the radar, with the first area of interest coming in around 1.2230 (50% retracement) followed by the Fibonacci overlap around 1.2320 (23.6% retracement) to 1.2370 (61.8% expansion).
- Keeping a close eye on the former-resistance zone around 1.1960 (38.2% retracement) for support along with the RSI as it comes off of overbought territory, with the next downside region of interest coming in around 1.1810 (61.8% retracement).

Click Here for the DailyFX Calendar
--- Written by David Song, Currency Analyst
To contact David, e-mail dsong@dailyfx.com. Follow me on Twitter at @DavidJSong.
To be added to David's e-mail distribution list, please follow this link.


