


Talking Points:
- USD/CAD Eyes November-Low (1.2666) Ahead of BoC Rate Decision.
- EUR/USD Clings to Narrow Range Ahead of U.S. Non-Farm Payrolls (NFP) Report.
USD/CAD gives back the advance from earlier this week as Canada added a staggering 79.5K jobs in November, with the 3Q Gross Domestic Product (GDP) report beating market expectations, and the pair may exhibit a more bearish behavior over the near-term should the Bank of Canada (BoC) show a greater willingness to further normalize monetary policy in 2018.
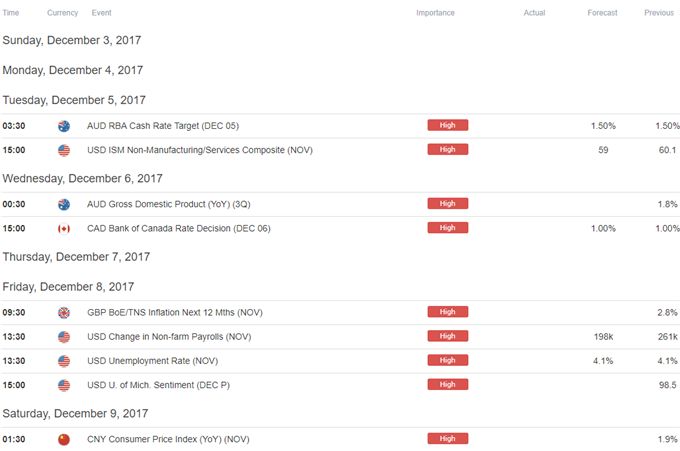
Even though the BoC is largely anticipated to retain the current policy at its last 2017 interest rate decision on December 6, the central bank may strike a more hawkish tone as the ongoing improvement in the labor market pushes the Unemployment Rate down to an annualized 5.9%, the lowest reading since 2008. In turn, Governor Stephen Poloz and Co. may prepare Canadian households and businesses for higher borrowing-costs as ‘less monetary policy stimulus will likely be required over time.’
With that said, USD/CAD may threaten the range-bound price action carried over from November as it marks another failed attempt to test the key former-support zone around1.2980 (61.8% retracement) to 1.3030 (50% expansion), with the pair facing a growing risk of giving back the rebound from the 2017-low (1.2061) as a bear-flag appears to be taking shape.
USD/CAD Daily Chart

- A move below 1.2720 (38.2% retracement) may spur a test of the November-low (1.2670), with the next downside target coming in around 1.2620 (50% retracement), which sits below the 50-Day SMA (1.2655).
- Keeping a close eye on the Relative Strength Index (RSI) as it pulls back ahead of overbought territory and approaches trendline support; may see a bearish RSI trigger materialize over the days ahead should the oscillator snap the upward trend from August.
EUR/USD may continue to consolidate following the limited reaction to the below-forecast ISM Manufacturing survey as the pair preserves the range-bounce price action from earlier this week.
The monthly opening range for EUR/USD is in focus as the U.S. Non-Farm Payrolls (NFP) report is anticipated to show the economy adding another 200K jobs in November, while Average Hourly Earnings are projected to increase an annualized 2.7% after expanding 2.4% in October. A further improvement in labor market dynamics accompanied by signs of stronger wage growth may undermine the near-term resilience in the euro-dollar exchange rate as the Federal Open Market Committee (FOMC) appears to be on course to deliver a December rate-hike.
However, another batch of mixed data prints may undermine the Fed’s scope to implement higher borrowing-costs in 2018, and market participants may pay increased attention to the updated projections coming out of the central bank amid the upcoming rotation within the FOMC.
EUR/USD Daily Chart

- Topside targets remain on the radar for EUR/USD as it holds above the former-resistance zone around 1.1810 (61.8% retracement) to 1.1860 (161.8% expansion), with a break/close above 1.1960 (38.2% retracement) hurdle raising the risk for a run at the 2017-high (1.2092).
- Next region of interest coming in around 1.2130 (50% retracement) followed by the 1.2230 (50% retracement) region.
- May see a larger recovery unfold as both price and the Relative Strength Index (RSI) break out of the bearish formations from September, but need to closely watch the oscillator as it clings to trendline support, with the failed attempt to break above 70 raising the risk for range-bound prices.
Want to learn more about popular trading indicators and tools such as the RSI? Download and review the FREE DailyFX Advanced trading guides !
Click Here for the DailyFX Calendar
Interested in having a broader discussion on current market themes? Sign up and join DailyFX Currency Analyst David Song LIVE for an opportunity to discuss potential trade setups!
--- Written by David Song, Currency Analyst
To contact David, e-mail dsong@dailyfx.com. Follow me on Twitter at @DavidJSong.
To be added to David's e-mail distribution list, please follow this link.


