


Talking Points:
- USD/JPY to Extend Bearish Sequence on Lackluster ISM Manufacturing Survey.
- New Zealand Dollar Outlook Hinges on 2Q Employment Report.
- DailyFX 3Q Forecasts Are Now Available.
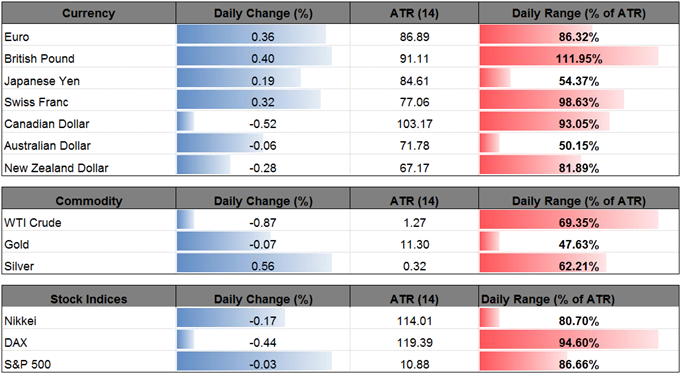
| Ticker | Last | High | Low | Daily Change (pip) | Daily Range (pip) |
|---|---|---|---|---|---|
| USD/JPY | 110.47 | 110.77 | 110.31 | 17 | 46 |
Another batch of lackluster U.S. data prints may fuel the bearish sequence in USD/JPY as market participants scale back bets for three Fed rate-hikes in 2017.
The dollar-yen exchange rate may continue to give back the rebound from the June-low (108.80) as the ISM Manufacturing survey is expected to narrow in July. A marked slowdown may also drag on interest rate expectations as the Federal Open Market Committee (FOMC) adopts a less-hawkish tone and warns ‘overall inflation and the measure excluding food and energy prices have declined and are running below 2 percent.’
Even though the ‘Committee expects to begin implementing its balance sheet normalization program relatively soon,’ lackluster data prints coming out of the U.S. economy may encourage the FOMC to highlight a more shallow path for the benchmark interest rate as Chair Janet Yellen argues the ‘federal funds rate would not have to rise all that much further to get to a neutral policy stance.’ As a result, the ongoing weakness in U.S. Treasury Yields may keep the dollar-yen exchange rate capped throughout the remainder of the year as Fed Fund Futures continue to price a 50/50 chance for a December rate-hike.
USDJPY Daily

Chart - Created Using Trading View
- Near-term outlook for USD/JPY remains tilted to the downside as the pair extends the series of lower highs & lows from the previous week, with the next region of interest coming in around 109.40 (50% retracement) to 109.90 (78.6% expansion) followed by the Fibonacci overlap around 108.30 (61.8% retracement) to 108.40 (100% expansion), which sits just under the June-low (108.80).
- However, the price action from June may recur, with a failed attempt to break/close below the 109.40 (50% retracement) hurdle raising the risk for a move back towards 111.10 (61.8% expansion) to 111.60 (38.2% retracement).
| Ticker | Last | High | Low | Daily Change (pip) | Daily Range (pip) |
|---|---|---|---|---|---|
| NZD/USD | 0.7493 | 0.7523 | 0.7468 | 1 | 55 |
The New Zealand dollar struggles to hold its ground ahead of the 2Q Employment report, with NZD/USD at risk for a larger pullback as the reading is expected to slow for the third consecutive quarter.
Another downtick in the headline print may trigger a bearish reaction in NZD/USD as it encourages the Reserve Bank of New Zealand (RBNZ) to preserve the record-low cash rate throughout 2017. However, signs of a tightening labor market may limit the downside risk for the kiwi-dollar exchange rate as Private Wages are projected to increase for the first time since 2015.
A pickup in household earnings paired with a decline in the jobless rate may push Governor Graeme Wheeler to slowly alter the outlook for monetary policy as ‘non-tradables and wage inflation remain moderate but are expected to increase gradually.’ Despite the verbal intervention from RBNZ officials, NZD/USD may exhibit a bullish behavior throughout the remainder of the year as it breaks out of the downward trend carried over from 2016.
NZD/USD Daily
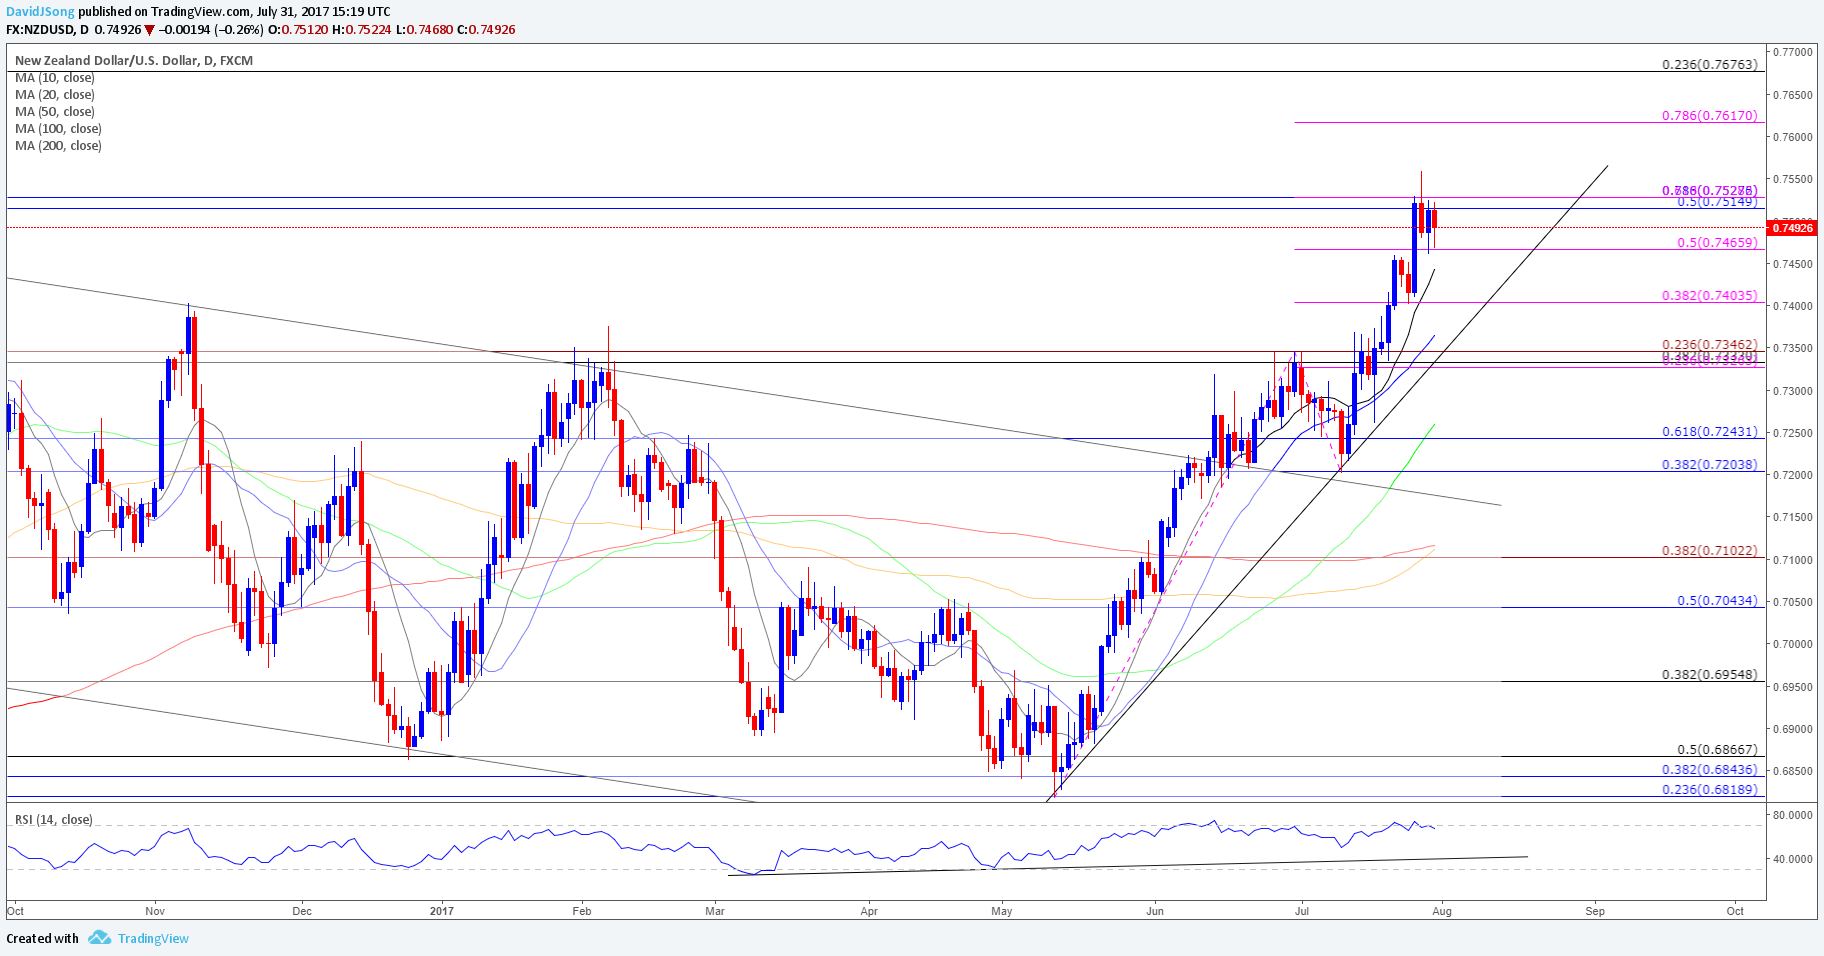
Chart - Created Using Trading View
- Broader outlook for NZD/USD has perked up as it breaks out of the 2016-range, with the next topside hurdle coming in around 0.7620 (78.6% expansion) followed by .07680 (23.6% retracement).
- However, the lack of momentum to close above the Fibonacci overlap around 0.7520 (50% expansion) 0.7530 (78.6% retracement) raises the risk for a near-term pullback especially as the Relative Strength Index (RSI) appears to be coming off of overbought territory.
- As a result, a close below 0.7460 (50% expansion) may spur a move back towards the 0.7400 handle, with the next downside region of interest coming in around the former-resistance zone around 0.7330 (38.2% retracement) to 0.7350 (23.6% expansion).
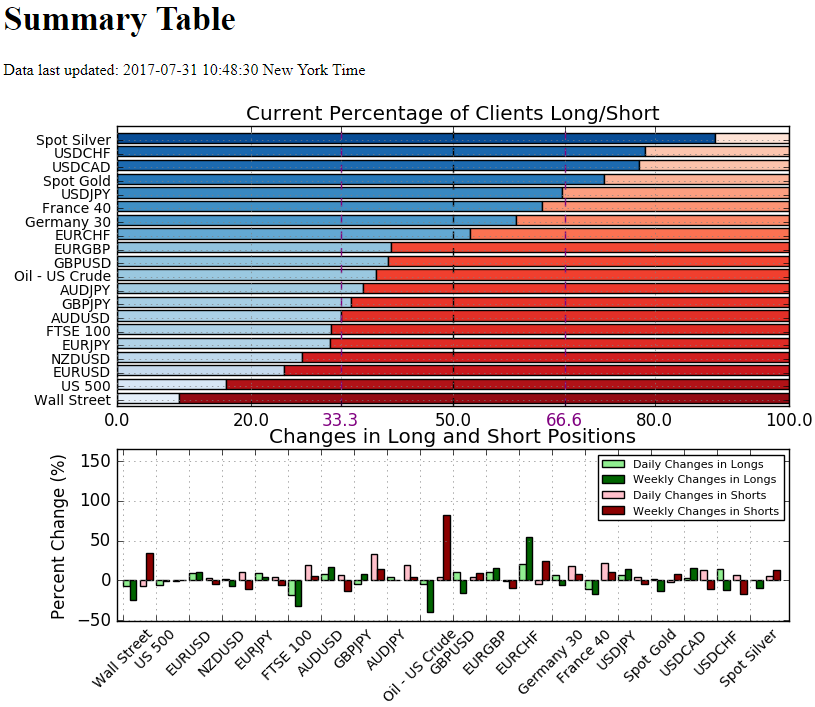
Track Retail Sentiment with the New Gauge Developed by DailyFX Based on Trader Positioning
- Retail trader data shows 66.2% of traders are net-long USD/JPY with the ratio of traders long to short at 1.96 to 1. In fact, traders have remained net-long since July 18 when USD/JPY traded near 112.602; price has moved 1.9% lower since then. The number of traders net-long is 6.2% higher than yesterday and 14.8% higher from last week, while the number of traders net-short is 4.4% higher than yesterday and 4.9% lower from last week.
- Retail trader data shows 27.6% of traders are net-long NZD/USD with the ratio of traders short to long at 2.62 to 1. In fact, traders have remained net-short since May 24 when NZD/USD traded near 0.68667; price has moved 9.0% higher since then. The number of traders net-long is 1.2% higher than yesterday and 6.9% lower from last week, while the number of traders net-short is 10.3% higher than yesterday and 10.3% lower from last week.
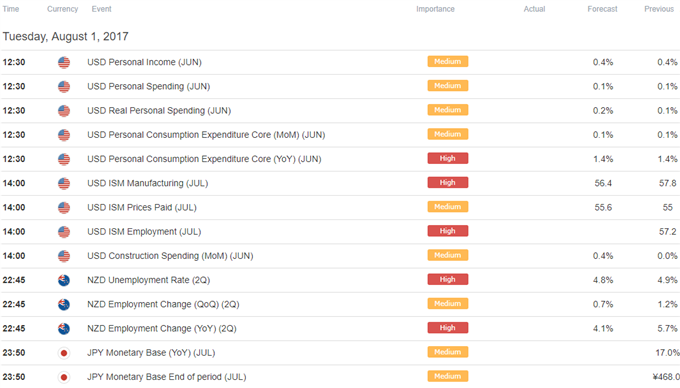
Click Here for the DailyFX Calendar
--- Written by David Song, Currency Analyst
To contact David, e-mail dsong@dailyfx.com. Follow me on Twitter at @DavidJSong.
To be added to David's e-mail distribution list, please follow this link.


