


Talking Points:
- USD/JPY Outlook Unfazed by BoJ, Weakness to Persist on Less-Hawkish FOMC.
- Australian Dollar Struggles Ahead of 2Q CPI as RBA Reiterates FX Risk.
- USD/JPY Retail Net-Shorts Slip 24.5% from Previous Week.
| Ticker | Last | High | Low | Daily Change (pip) | Daily Range (pip) |
|---|---|---|---|---|---|
| USD/JPY | 111.17 | 112.08 | 111.15 | 74 | 93 |
The near-term outlook for USD/JPY appears to be unfazed by the dovish comments coming out of the Bank of Japan (BoJ) as the pair slowly works its way back towards the June-low (108.80).
USD/JPY slips to fresh monthly lows even as the Bank of Japan (BoJ) now expects to achieve the 2% inflation-target in fiscal-year 2019, and the pair stands at risk of facing additional losses next week should the Federal Open Market Committee (FOMC) show a greater willingness to retain the current policy for the foreseeable future. Despite talks of unloading of the balance sheet, Chair Janet Yellen and Co. may attempt to buy more time amid the mixed data prints coming out of the U.S. economy, and the greenback may struggle to hold its ground in the second-half of the year as Fed Fund Futures continue to show a 50/50 chance for another rate-hike in 2017.
USD/JPY Daily
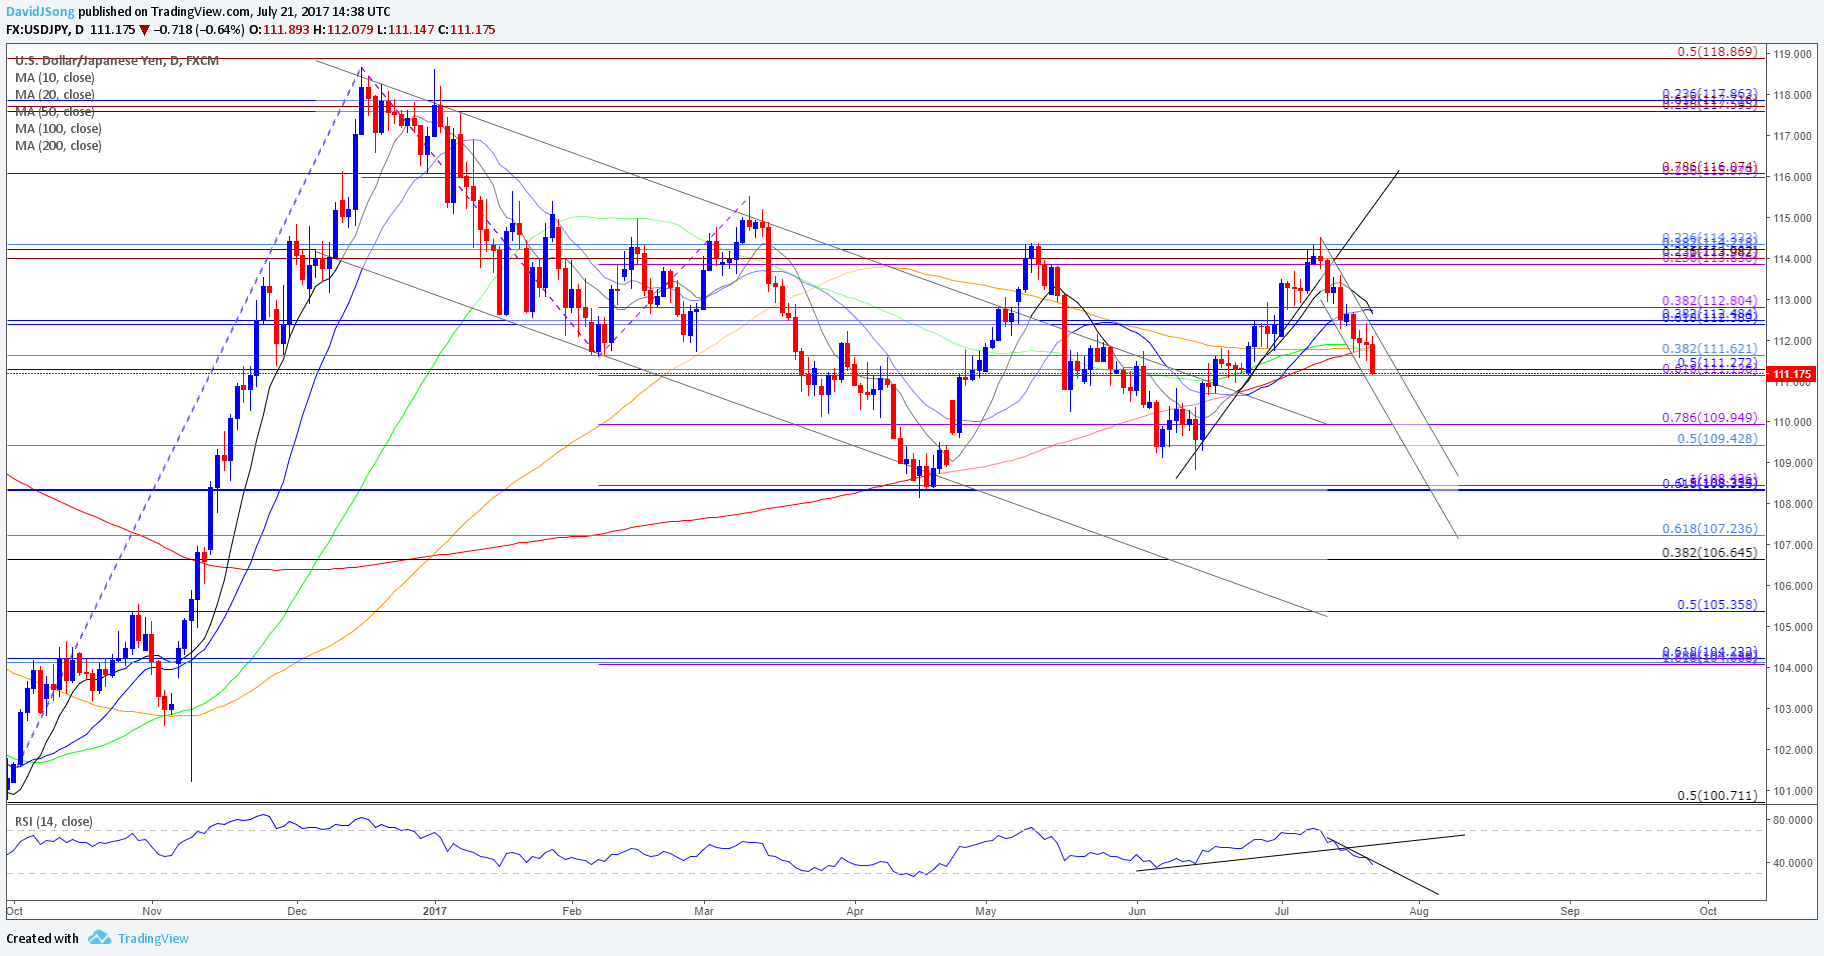
Chart - Created Using Trading View
- USD/JPY comes up against the near-term support zone around 111.10 (61.8% expansion) to 111.60 (38.2% retracement), but the near-term outlook remains tilted to the downside as both price and the Relative Strength Index (RSI) carve a bearish formation going into the last full-week of July.
- Next region of interest comes in around 109.40 (50% retracement) to 109.90 (78.6% expansion) followed by the June-low (108.80), which sits just above the Fibonacci overlap coming in at 108.30 (61.8% retracement) to 108.40 (100% expansion).
| Ticker | Last | High | Low | Daily Change (pip) | Daily Range (pip) |
|---|---|---|---|---|---|
| AUD/USD | 0.7917 | 0.7959 | 0.7875 | 41 | 84 |
Fresh rhetoric coming out of the Reserve Bank of Australia (RBA) appears to have tamed the near-term rally in AUD/USD, with the pair at risk for a near-term pullback as it fails to extend the series of higher-highs from earlier this week.
RBA Deputy Governor Guy Debelle argued ‘no significance should be read into the fact the neutral rate was discussed at this particular meeting’ as the central bank keeps the official cash rate at the record-low, and went onto say that the strength in the local currency ‘isn’t helpful’ amid the ongoing adjustment in the Australian economy. Despite forecasts for an uptick in the region’s 2Q Consumer Price Index (CPI), a downtick in the core measure for inflation may drag on the Australian dollar as it encourages the RBA to stay on the sidelines throughout 2017.
AUD/USD Daily
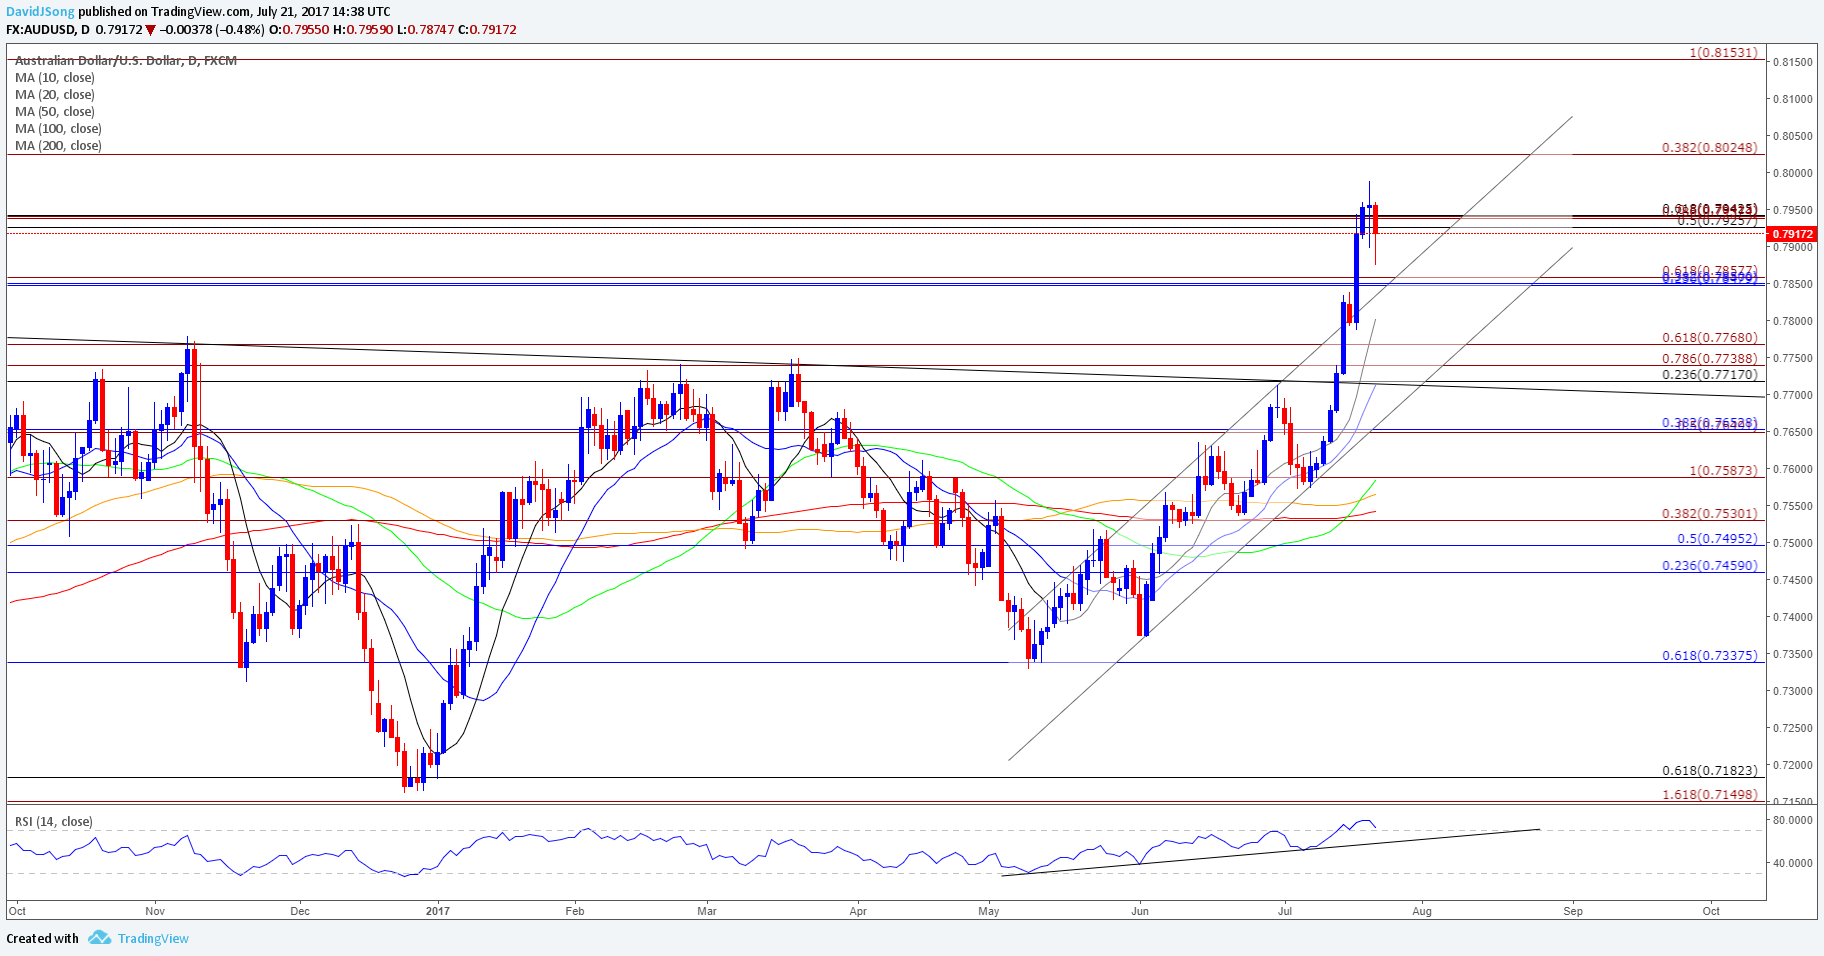
Chart - Created Using Trading View
- The near-term advance in AUD/USD appears to be stalling ahead of the 0.8020 (38.2% expansion) hurdle, with the pair at risk for further losses should the Relative Strength Index (RSI) flash a textbook sell-signal and slip below 70.
- First downside region of interest comes in around 0.7850 (38.2% retracement) to 0.7860 (61.8% expansion) followed by the former-resistance zone around 0.7740 (78.6% expansion) to 0.7770 (61.8% expansion)
- Keep in mind the broader outlook for AUD/USD has perked up as the pair breaks out of the 2016-range, while price and the RSI retain the bullish formations carried over from earlier this year.
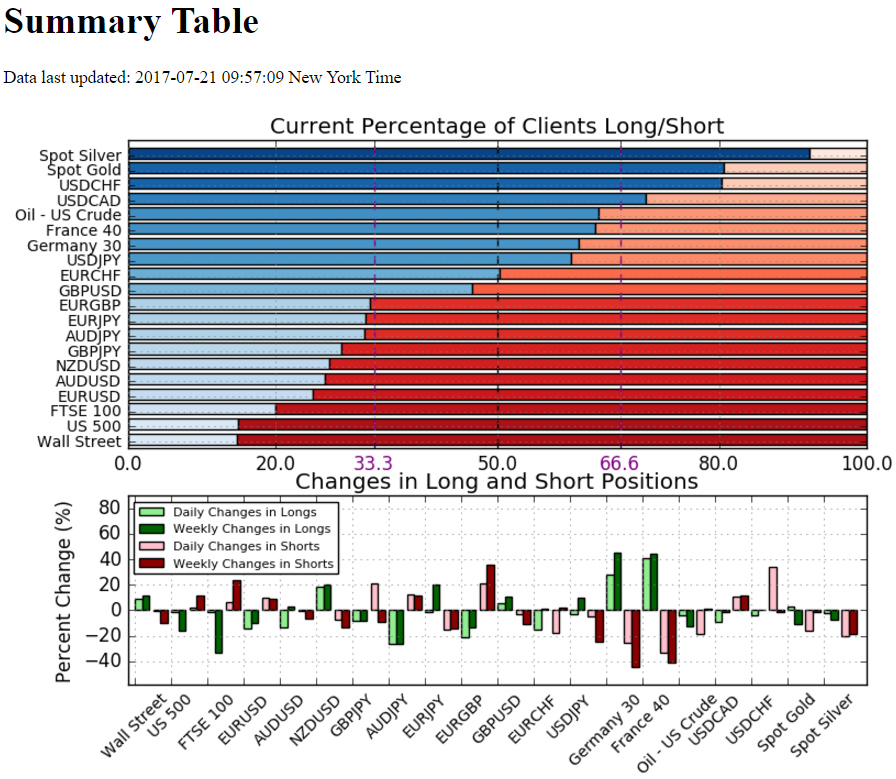
Track Retail Sentiment with the New Gauge Developed by DailyFX Based on Trader Positioning
- Retail trader data shows 59.9% of traders are net-long USD/JPY with the ratio of traders long to short at 1.49 to 1. The percentage of traders net-long is now its highest since June 29 when USD/JPY traded near 111.959. The number of traders net-long is 3.3% lower than yesterday and 10.0% higher from last week, while the number of traders net-short is 5.2% lower than yesterday and 24.5% lower from last week.
- Retail trader data shows 26.7% of traders are net-long AUD/USD with the ratio of traders short to long at 2.75 to 1. In fact, traders have remained net-short since June 04 when AUD/USD traded near 0.74595; price has moved 6.2% higher since then. The number of traders net-long is 13.1% lower than yesterday and 2.8% higher from last week, while the number of traders net-short is 0.3% lower than yesterday and 6.3% lower from last week.
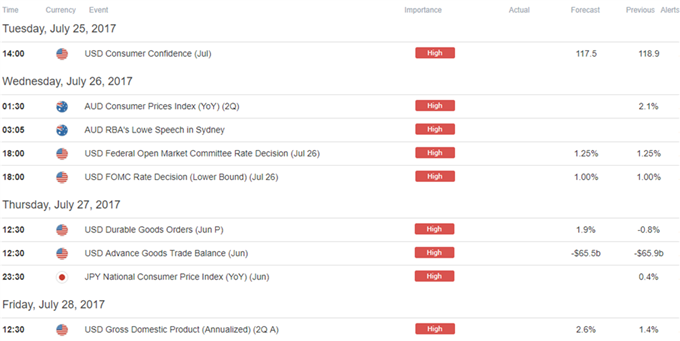
Click Here for the DailyFX Calendar
--- Written by David Song, Currency Analyst.
To contact David, e-mail dsong@dailyfx.com. Follow me on Twitter at @DavidJSong.
To be added to David's e-mail distribution list, please follow this link.


