


Talking Points:
- AUD/USD Rallies to Fresh 2017-High as RBA Removes Easing Bias.
- GBP/USD June Rebound Unravels as U.K. CPI Disappoints.
- DailyFX 3Q Forecasts Are Now Available.
| Ticker | Last | High | Low | Daily Change (pip) | Daily Range (pip) |
|---|---|---|---|---|---|
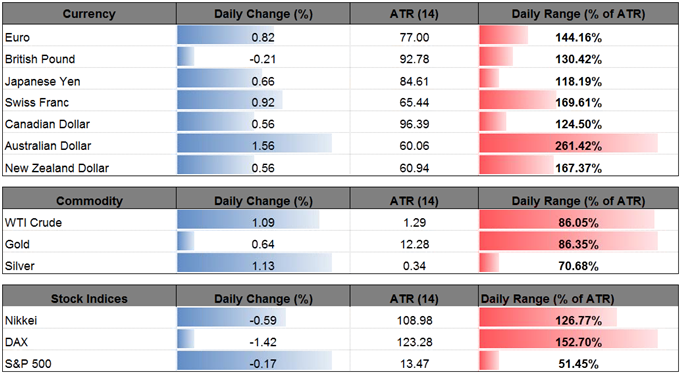
| AUD/USD | 0.7923 | 0.7943 | 0.7786 | 122 | 157 |
AUD/USD breaks the 2016 range, with the pair at risk for a further advance as the Reserve Bank of Australia (RBA) start to discuss future changes to the official cash rate.
The RBA Minutes suggest Governor Philip Lowe and Co. are now on course to remove the record-low interest rate as officials forecast ‘a neutral nominal cash rate of around 3½ per cent.’ Even though ‘developments in the labour and housing markets continued to warrant careful monitoring,’ the RBA may continue to change its tune over the coming months as ‘the data available for the June quarter had generally been positive, following the slower growth recorded for the March quarter.’
As a result, the employment report due out later this week may fuel the near-term resilience in the Australian dollar as the economy is anticipated to add another 15.0K jobs in June.
AUD/USD Daily
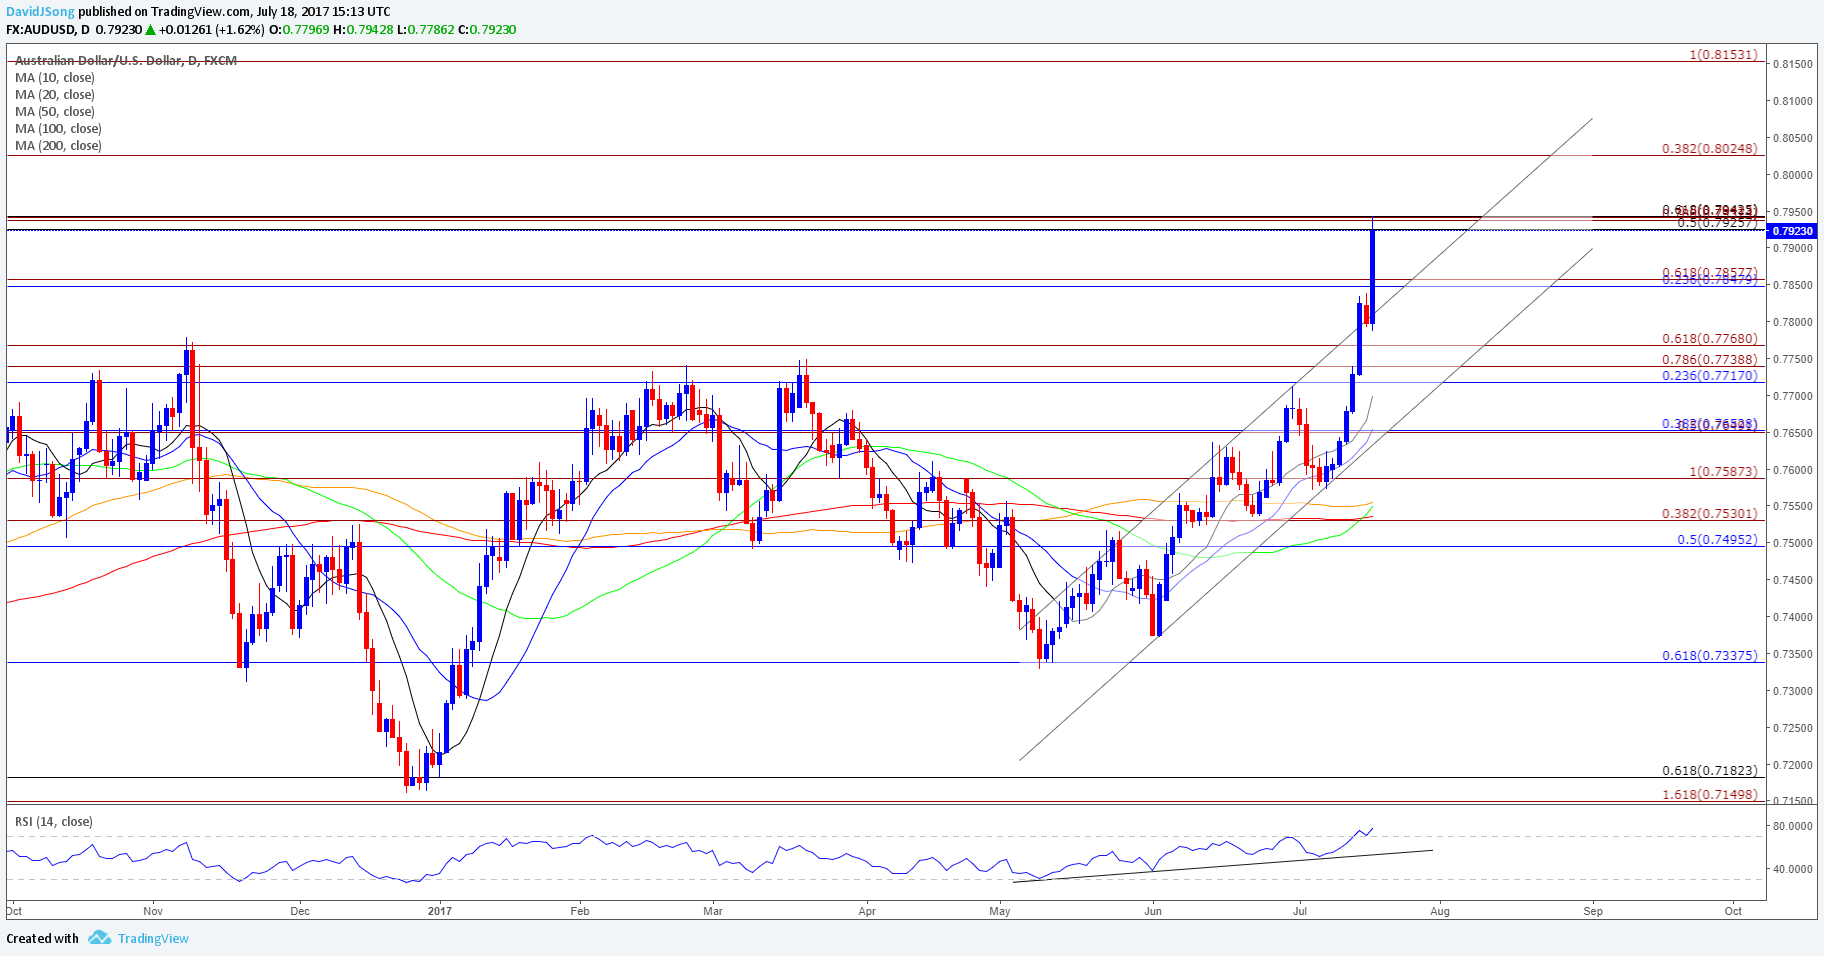
Chart - Created Using Trading View
- The Fibonacci overlap around 0.7930 (50% retracement) to 0.7940 (61.8% retracement) appears to be capping the AUD/USD rally, but the near-term outlook remains constructive as price and the Relative Strength Index (RSI) preserve the bullish formations carried over from May.
- Keep in mind the RSI is trading above 70 for the first time since 2014, with the aussie-dollar exchange rate at risk for a further advance as the momentum indicator pushes deeper into overbought territory.
- May see the former resistance-zone around 0.7740 (78.6% expansion) to 0.7770 (61.8% expansion) now act as support, with the next topside hurdle coming in around 0.8020 (38.2% expansion) followed by the 0.8150 (100% expansion) region.
| Ticker | Last | High | Low | Daily Change (pip) | Daily Range (pip) |
|---|---|---|---|---|---|
| GBP/USD | 1.3027 | 1.3126 | 1.3005 | 28 | 121 |
The British Pound lags behind its major counterparts as the U.K. Consumer Price Index (CPI) unexpectedly slowed in June, and GBP/USD may continue to give back the advance from the June-low (1.2589) as the narrowing threat for above-target inflation drags on interest-rate expectations.
Even though the Retail Sales report is expected to show a rebound in household spending, easing price pressures may keep the Bank of England (BoE) on the sidelines as officials note ‘pay growth has moderated further from already subdued rates, even as the unemployment rate has fallen to 4.6%, its lowest in over 40 years.’ As a result, the majority of BoE officials may merely look to buy more time at the next meeting on August 3 amid the mixed data prints coming out of the U.K. economy.
GBP/USD Daily

Chart - Created Using Trading View
- GBP/USD stands at risk for further losses following the string of failed attempts to close above the Fibonacci overlap around 1.3090 (38.2% retracement) to 1.3120 (78.6% retracement), while the Relative Strength Index (RSI) continues to come off of trendline resistance.
- A break below 1.2950 (23.6% retracement) may spur a move back towards 1.2860 (61.8% retracement), with the next downside hurdle coming in around 1.2630 (38.2% expansion) to 1.2680 (50% retracement), which sits just below the 100-Day SMA (1.2712).
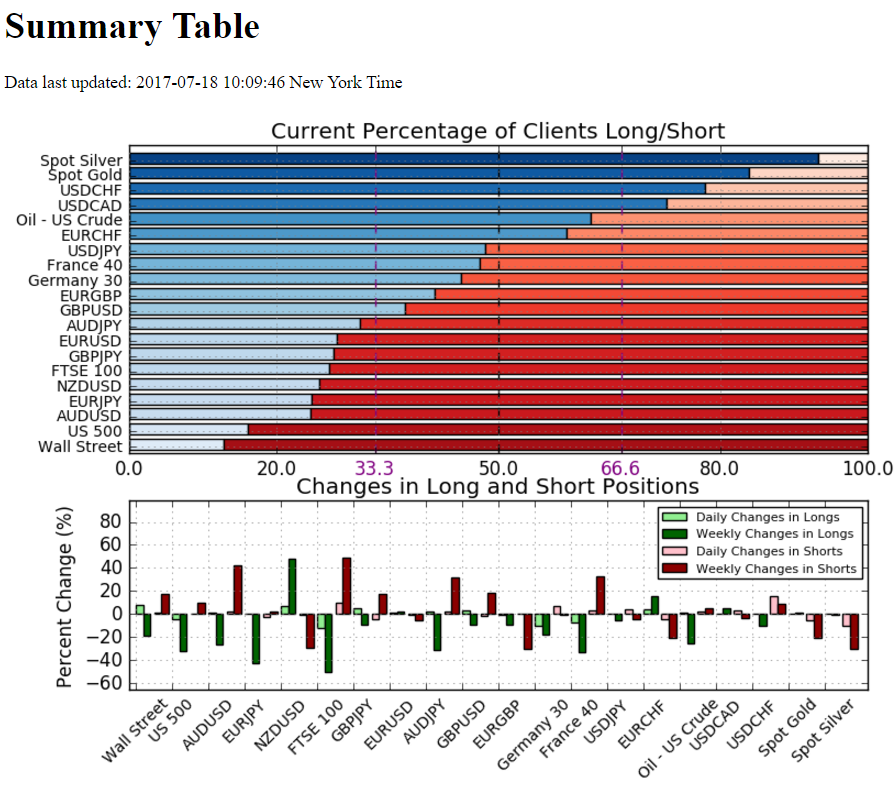
Track Retail Sentiment with the New Gauge Developed by DailyFX Based on Trader Positioning
- Retail trader data shows 24.6% of traders are net-long AUD/USD with the ratio of traders short to long at 3.06 to 1. In fact, traders have remained net-short since June 4 when AUD/USD traded near 0.74595; price has moved 6.3% higher since then. The number of traders net-long is 0.8% higher than yesterday and 26.2% lower from last week, while the number of traders net-short is 2.2% higher than yesterday and 42.2% higher from last week.
- Retail trader data shows 37.3% of traders are net-long GBP/USD with the ratio of traders short to long at 1.68 to 1. In fact, traders have remained net-short since June 23 when GBP/USD traded near 1.26263; price has moved 3.2% higher since then. The number of traders net-long is 3.0% higher than yesterday and 9.2% lower from last week, while the number of traders net-short is 1.3% lower than yesterday and 18.0% higher from last week.
Click Here for the DailyFX Calendar
--- Written by David Song, Currency Analyst
To contact David, e-mail dsong@dailyfx.com. Follow me on Twitter at @DavidJSong.
To be added to David's e-mail distribution list, please follow this link.


