


Talking Points:
- USD/JPY June Rebound Unravels, Bearish RSI Trigger Takes Shape.
- GBP/USD RSI Divergence Emerges Ahead of U.K. Consumer Price Index (CPI).
- Join DailyFX Market Analyst Martin Essex LIVE to Cover the U.K. CPI Report.
| Ticker | Last | High | Low | Daily Change (pip) | Daily Range (pip) |
|---|---|---|---|---|---|
| USD/JPY | 112.74 | 112.87 | 112.33 | 19 | 54 |
USD/JPY may continue to give back rebound from the June-low (108.80) as market participants push back bets for the next Fed rate-hike.
The Bank of Japan’s (BoJ) July 20 meeting is likely to spark a limited reaction in USD/JPY as Governor Haruhiko Kuroda and Co. stick to the Quantitative/Qualitative Easing (QQE) Program with Yield-Curve Control, and narrowing bets for higher U.S. borrowing-costs may continue to drag on the dollar-yen exchange rate as Chair Janet Yellen warns ‘the federal funds rate would not have to rise all that much further to get to a neutral policy stance.’ With Fed Fund Futures pricing a 50% probability for a move in December, USD/JPY stands at risk of facing range-bound conditions over the near-term amid waning expectations for three rate-hikes in 2017.
USD/JPY Daily
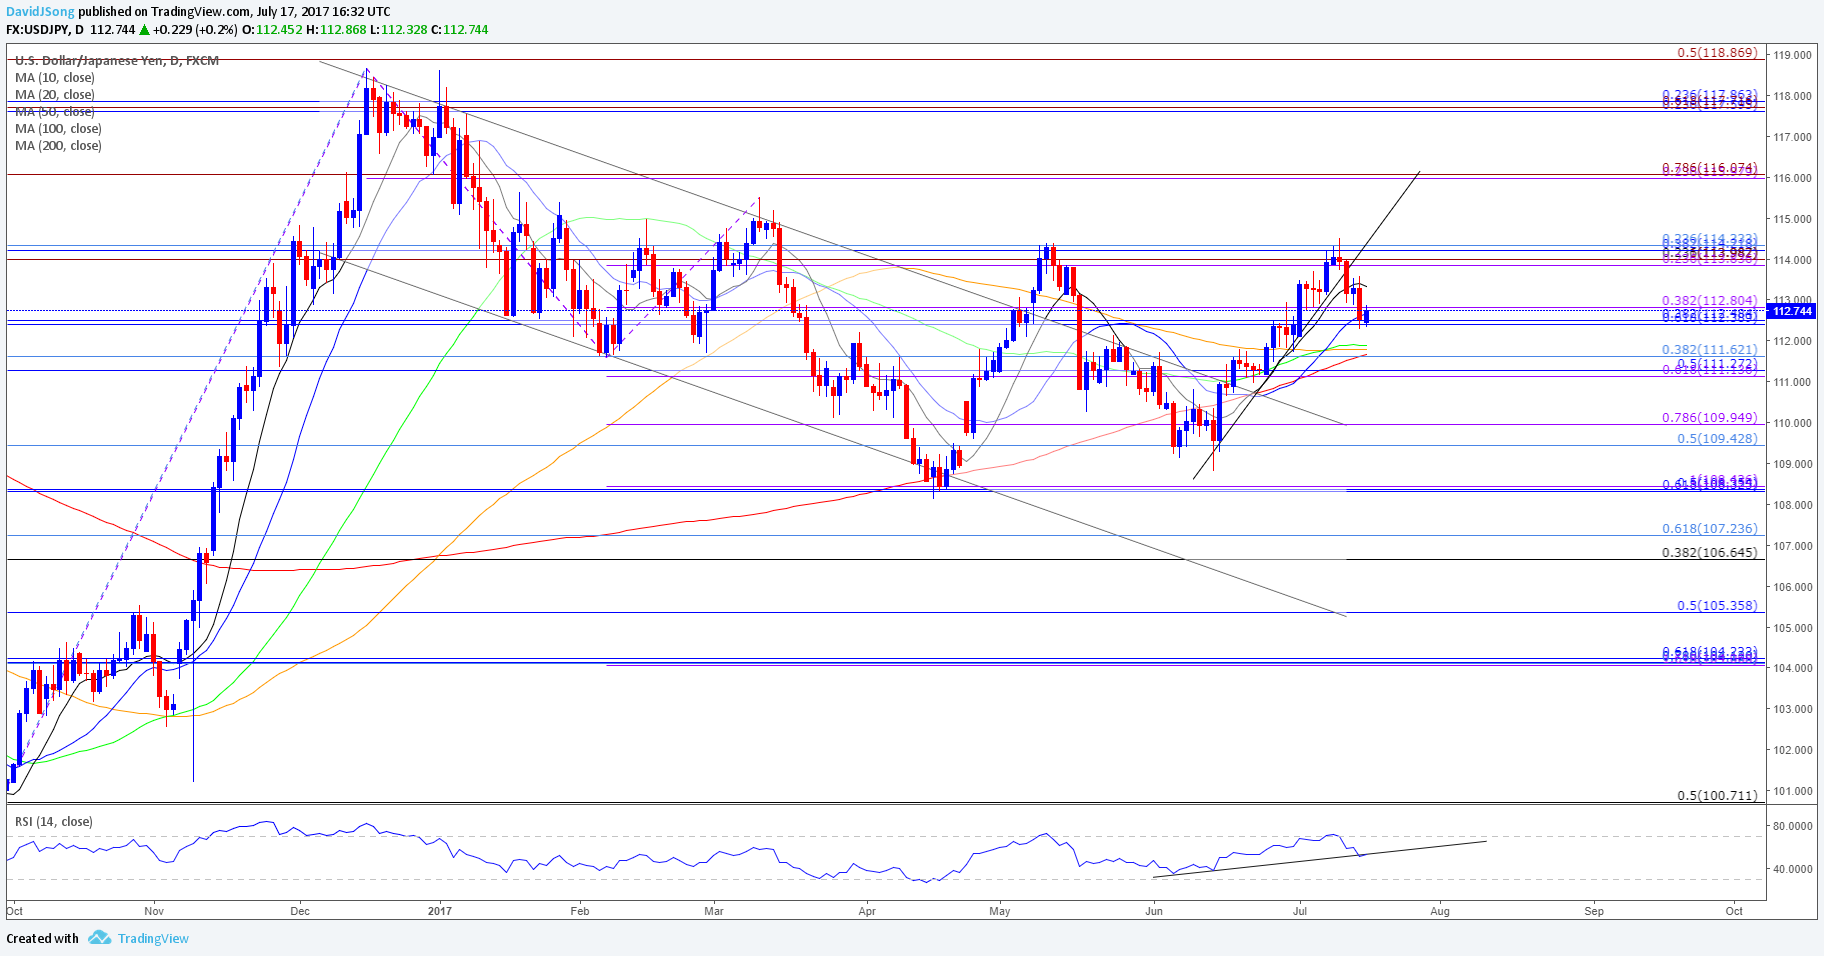
Chart - Created Using Trading View
- The failed attempt to close above the Fibonacci overlap around 113.80 (23.6% expansion) to 114.30 (23.6% retracement) keeps the near-term bias tilted to the downside, with USD/JPY at risk for further losses as the Relative Strength Index (RSI) highlights a bearish trigger and threatens the upward trend carried over from the previous month.
- Waiting for a close below the 112.40 (61.8% retracement) hurdle to open up the monthly-low (112.08), with the next region of interest coming in around 111.10 (61.8% expansion) to 111.60 (38.2% retracement) followed by the Fibonacci overlap around 109.40 (50% retracement) to 109.90 (78.6% expansion).
| Ticker | Last | High | Low | Daily Change (pip) | Daily Range (pip) |
|---|---|---|---|---|---|
| GBP/USD | 1.3059 | 1.3117 | 1.3051 | 41 | 66 |
GBP/USD pulls back from a fresh 2017-high (1.3114), with the pair at risk for further losses should the U.K. Consumer Price Index (CPI) alleviate concerns of above-target inflation.
The CPI report may spark a bearish reaction in the British Pound as the headline and core readings are projected to hold steady in June, and signs of softening price growth may encourage the Bank of England (BoE) to preserve the record-low interest rate throughout 2017 as officials warn ‘pay growth has moderated further from already subdued rates, even as the unemployment rate has fallen to 4.6%, its lowest in over 40 years.’ In turn, the majority of the Monetary Policy Committee (MPC) may merely attempt to buy more time at the next meeting on August 3 especially as Brexit clouds the economic outlook for the region.
GBP/USD Daily
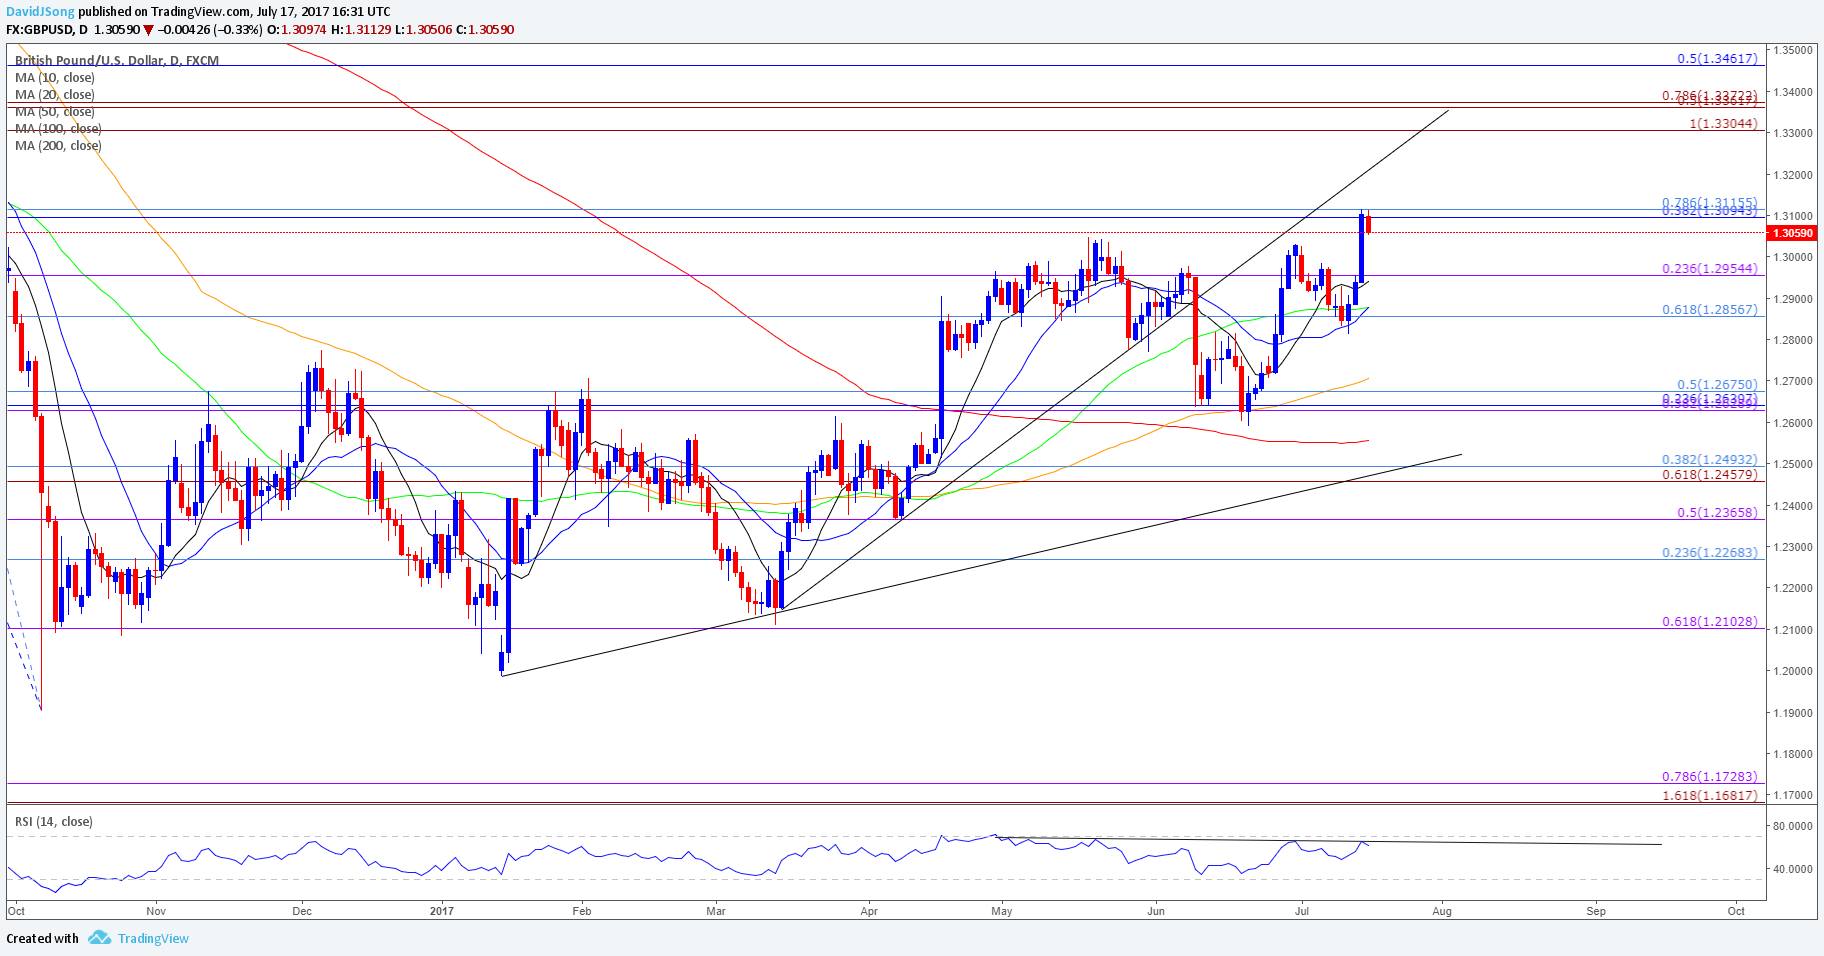
Chart - Created Using Trading View
- Even though GBP/USD clears the monthly opening range, the Relative Strength Index (RSI) has start to show a more significant deviation from price as the oscillator turns around ahead of overbought territory and largely retains the bearish formation carried over from May.
- Lack of momentum to break/close above the Fibonacci overlap around 1.3090 (38.2% retracement) to 1.3120 (78.6% retracement) may tame the resilience in GBP/USD, with a move back below 1.2950 (23.6% retracement) opening up the 1.2860 (61.8% retracement) hurdle; next downside region of interest coming in around 1.2630 (38.2% expansion) to 1.2680 (50% retracement), which sits just below the 100-Day SMA (1.2706).
- Nevertheless, an unexpected uptick in U.K. CPI may generate fresh 2017-highs in GBP/USD amid the growing dissent within the BoE, with the next topside hurdle coming in around the 1.3300 handle followed by the Fibonacci overlap around 1.3360 (50% expansion) to 1.3370 (78.6% expansion).

Track Retail Sentiment with the New Gauge Developed by DailyFX Based on Trader Positioning
- Retail trader data shows 48.2% of traders are net-long USD/JPY with the ratio of traders short to long at 1.07 to 1. The number of traders net-long is 7.8% higher than yesterday and 0.3% lower from last week, while the number of traders net-short is 22.6% higher than yesterday and 2.2% lower from last week.
- Retail trader data shows 37.3% of traders are net-long GBP/USD with the ratio of traders short to long at 1.68 to 1. In fact, traders have remained net-short since June 23 when GBP/USD traded near 1.26263; price has moved 3.4% higher since then. The number of traders net-long is 17.8% higher than yesterday and 2.7% lower from last week, while the number of traders net-short is 3.4% higher than yesterday and 15.8% higher from last week.
Click Here for the DailyFX Calendar
--- Written by David Song, Currency Analyst
To contact David, e-mail dsong@dailyfx.com. Follow me on Twitter at @DavidJSong.
To be added to David's e-mail distribution list, please follow this link.


