


Talking Points:
- Lackluster U.K. Inflation Report to Rattle GBP/USD Rally.
-USD/JPY Weakness to Persist as Bets for December Fed Rate-Hike Dwindle.
- Join the DailyFX Team LIVE to Cover Key Event Risks.
| Ticker | Last | High | Low | Daily Change (pip) | Daily Range (pip) |
|---|---|---|---|---|---|
| GBP/USD | 1.3091 | 1.3093 | 1.2936 | 152 | 157 |
Key data prints coming out of the U.K. economy may rattle the near-term advance in GBP/USD should the developments encourage the Bank of England (BoE) to maintain the record-low interest rate throughout 2017.
With both the headline and core Consumer Price Index (CPI) expected to hold steady in June, Governor Mark Carney and Co. may merely attempt to buy more time at the next meeting on August 3 as the economic outlook remains clouded with high uncertainty. Even though Monetary Policy Committee (MPC) member Ian McCafferty argues the BoE should reevaluate the fate of the quantitative easing (QE) program ‘given that other central banks are thinking about it,’ the narrow threat of above-target inflation may keep the majority on the sidelines for the foreseeable future especially as Silvana Tenreyro joins the central bank.
GBP/USD Daily

Chart - Created Using Trading View
- Near-term outlook for GBP/USD remains constructive as the pairclears the May-high (1.3048) and extends the series of higher highs & lows from earlier this week.
- The pound-dollar exchange rate may continue to mark fresh 2017-highs as the Relative Strength Index (RSI) comes up against trendline resistance; the momentum indicator may flash a bullish trigger, with the first topside hurdle coming in around 1.3090 (38.2% retracement) to 1.3120 (78.6% retracement) followed by the 1.3300 (100% expansion) handle.
- However, the bullish sequence in GBP/USD may largely unravel should the RSI continue to deviate with price, and a move back below 1.2950 (23.6% expansion) opens up the 1.2860 (61.8% retracement) region followed by the Fibonacci overlap around 1.2630 (38.2% expansion) to 1.2680 (50% retracement).
| Ticker | Last | High | Low | Daily Change (pip) | Daily Range (pip) |
|---|---|---|---|---|---|
| USD/JPY | 112..56 | 113.58 | 112.27 | 72 | 131 |
The rebound from the June-low (108.80) continues to unravel, with USD/JPY at risk for a further decline next week as lackluster data prints coming out of the U.S. economy drag on interest-rate expectations.
Fed Fund Futures are back to pricing a 50/50 chance for a December rate-hike as the U.S. Consumer Price Index (CPI) narrowed for the fourth consecutive month in June, and the Federal Open Market Committee (FOMC) may largely endorse a wait-and-see approach at the July 26 rate decision as the central bank struggles to achieve the 2% target for inflation. The cautious testimony from Chair Janet Yellen suggest Fed officials may now highlight a more shallow path for the benchmark interest rate especially as the Atlanta Fed GDP model continues to trim the 2Q forecast, and the committee may show a greater willingness to unload the balance sheet in 2018 as ‘the federal funds rate would not have to rise all that much further to get to a neutral policy stance.’
USD/JPY Daily
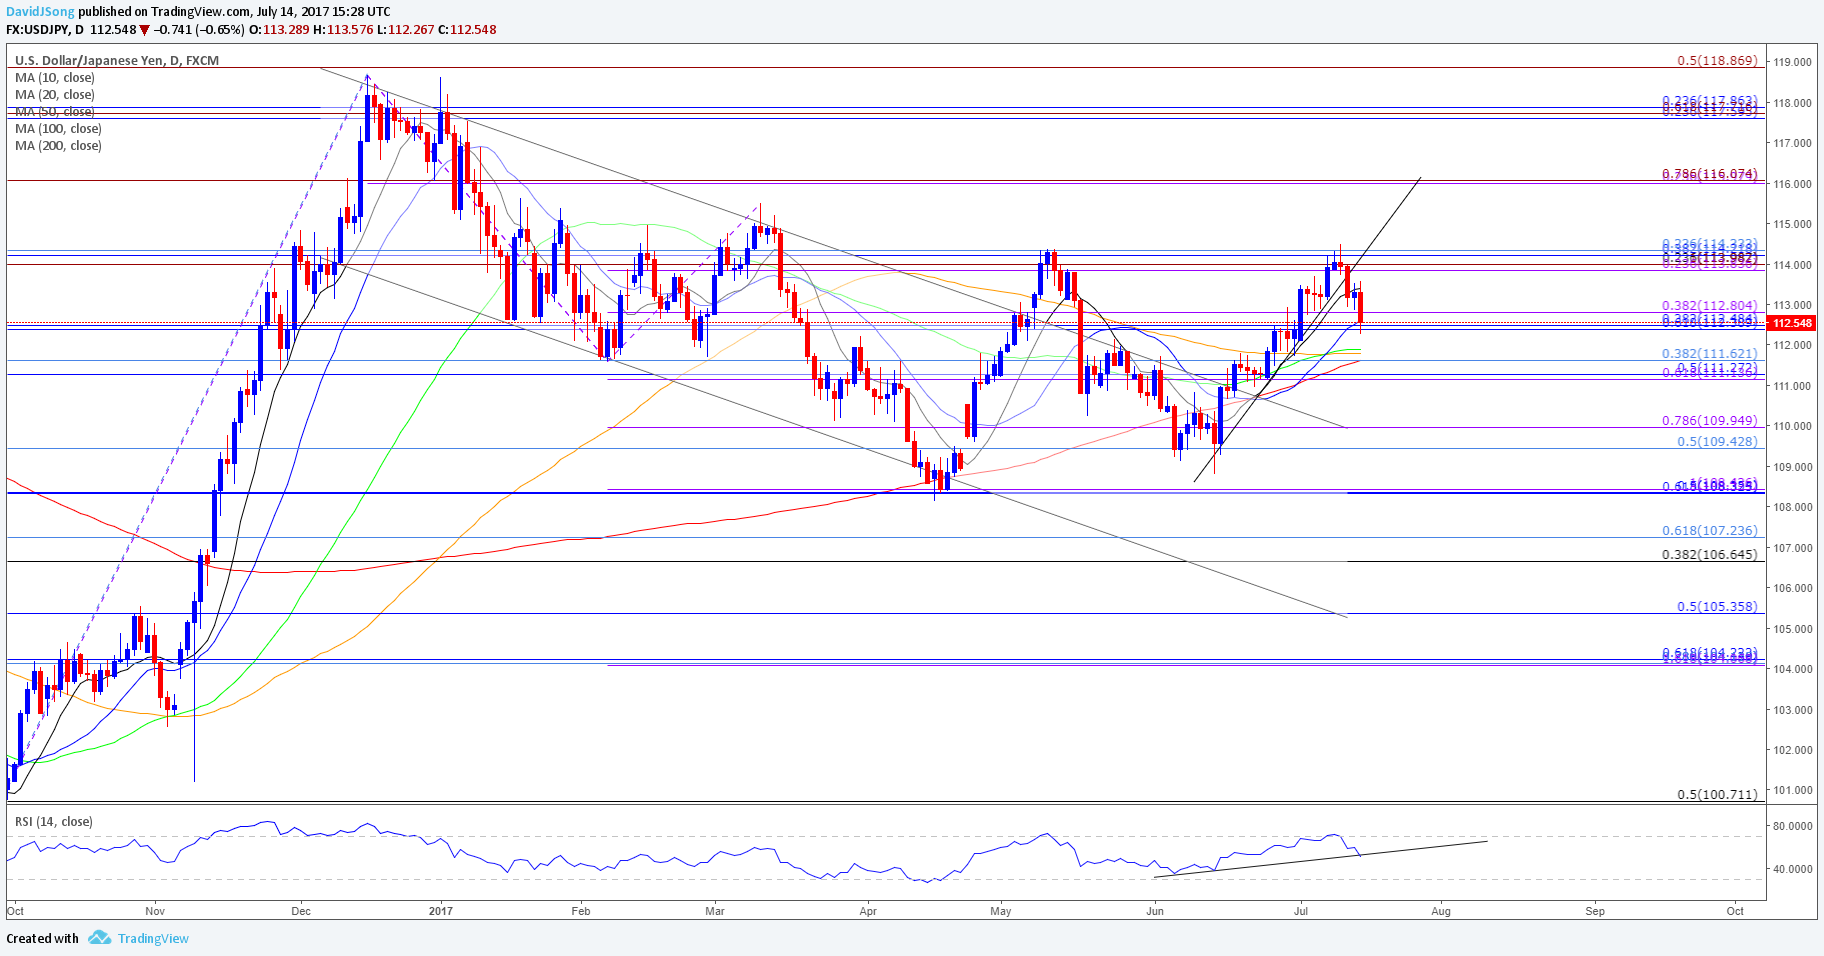
Chart - Created Using Trading View
- Downside targets remain on the radar for USD/JPY as the recovery from June unravels, with the Relative Strength Index (RSI) exhibiting a similar behavior; may see a bearish trigger emerge over the coming days as the momentum indicator comes up against trendline support.
- Need a close below the 112.40 (61.8% retracement) hurdle to open up the monthly-low (112.08), with the next region of interest coming in around 111.10 (61.8% expansion) to 111.60 (38.2% retracement) followed by the Fibonacci overlap around 10940 (50% retracement) to 109.90 (78.6% expansion).

Track Retail Sentiment with the New Gauge Developed by DailyFX Based on Trader Positioning
- Retail trader data shows 39.3% of traders are net-long GBP/USD with the ratio of traders short to long at 1.54 to 1. In fact, traders have remained net-short since June 23 when GBP/USD traded near 1.2673; price has moved 3.1% higher since then. The percentage of traders net-long is now its lowest since Jul 07 when GBPUSD traded near 1.28802. The number of traders net-long is 7.1% lower than yesterday and 1.4% lower from last week, while the number of traders net-short is 5.5% higher than yesterday and 3.1% higher from last week.
- Retail trader data shows 51.4% of traders are net-long USD/JPY with the ratio of traders long to short at 1.06 to 1. The number of traders net-long is 6.8% lower than yesterday and 2.6% lower from last week, while the number of traders net-short is 12.6% lower than yesterday and 12.1% lower from last week.Click Here for the DailyFX Calendar
--- Written by David Song, Currency Analyst
To contact David, e-mail dsong@dailyfx.com. Follow me on Twitter at @DavidJSong.
To be added to David's e-mail distribution list, please follow this link.


