


Talking Points:
- EUR/USD Monthly Range at Risk as Yellen Testifies in Front of Congress.
- Crude Oil Price Eye 2017-Low, U.S. Inventories to Contract for Second Consecutive Week.
- Q3 Forecasts have just been released and are available in our Trading Guides. And if you’re looking for something more interactive in nature, please check out our DailyFX Live webinars.
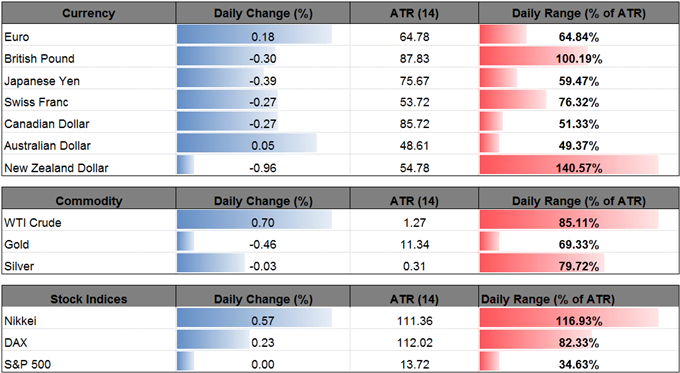
| Ticker | Last | High | Low | Daily Change (pip) | Daily Range (pip) |
|---|---|---|---|---|---|
| EUR/USD | 1.1419 | 1.1425 | 1.1383 | 20 | 42 |
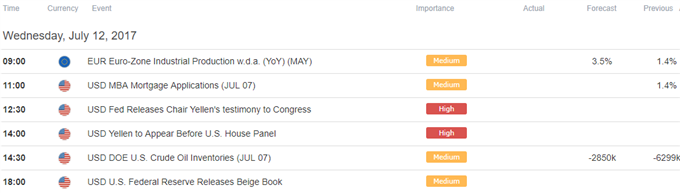
EUR/USD volatility may continue to dwindle ahead of the semi-annual Humphrey-Hawkins testimony, but the pair stands at risk of threatening the monthly opening range should fresh remarks from Fed Chair Janet Yellen shift market expectations.
Chair Yellen may strike a hawkish tone in front of the U.S. House Financial Services Committee amid the growing discussion to unload the balance sheet, and the greenback may catch a bid should the testimony highlight a more aggressive path in normalizing monetary policy. However, the central bank head may refrain from revealing anything new amid the mixed data prints coming out of the real economy, and the euro-dollar exchange rate may trade to fresh 2017-highs if Chair Yellen casts a more shallow path for the Fed Funds rate.
EUR/USD Daily
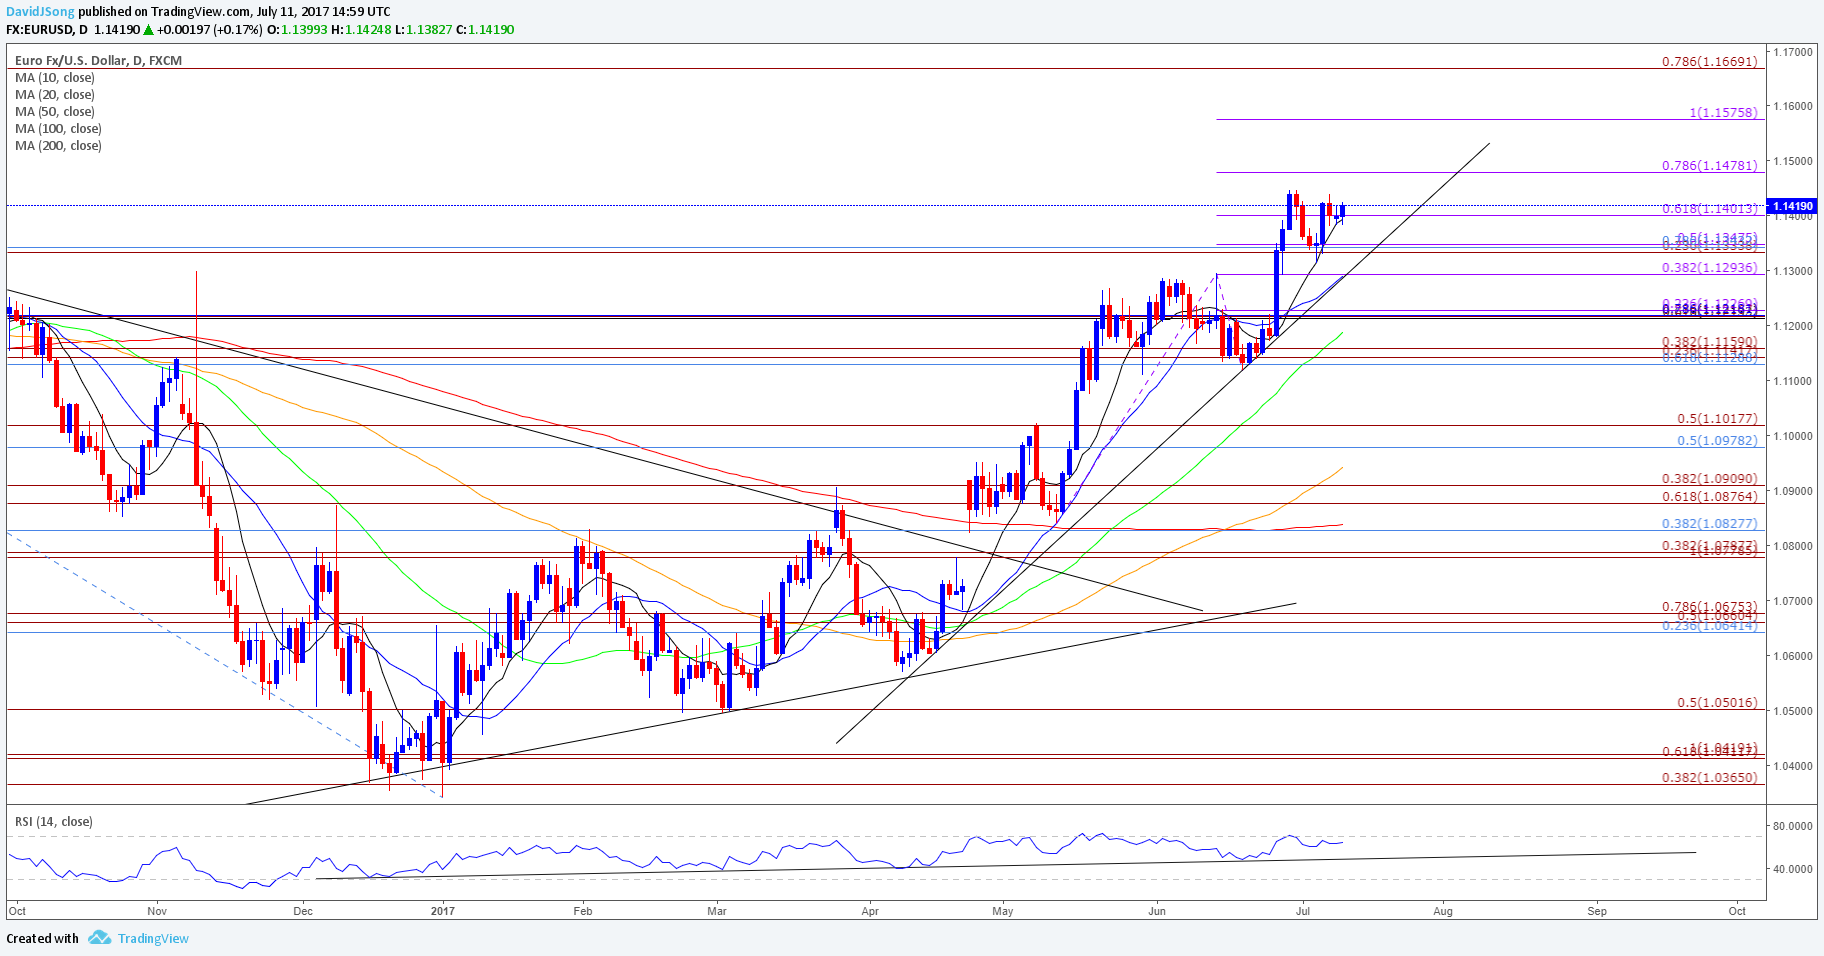
Chart - Created Using Trading View
- The near-term triangle/wedge formation in EUR/USD may give way to fresh yearly highs as price & the Relative Strength Index (RSI) retain the upward trends from late-2016, with near-term support coming in around 1.1330 (23.6% retracement) to 1.1350 (50% expansion), which largely lines up with trendline support.
- Need a break of the June-high (1.1446) to open up the 1.1480 (78.6% expansion) hurdle, with the next region of interest coming in around 1.1580 (100% expansion).
- However, failure to hold above the monthly-low (1.1312) may stoke a larger correction in EUR/USD, with the first downside target coming in around 1.1290 (38.2% expansion) followed by the Fibonacci overlap around 1.1210 (61.8% retracement) to 1.1230 (23.6% expansion).
| Ticker | Last | High | Low | Daily Change ($) | Daily Range ($) |
|---|---|---|---|---|---|
| USOIL | 1.2876 | $44.88 | $43.81 | 12 | 1.07 |
Crude oil is quickly approaching the 2017-low ($42.08), with a wave of major banks now forecasting lower energy prices as the longer-term outlook for global supply appears to be shifting towards a higher trajectory.
With Iran on course to increase its energy output, the broader outlook for crude remains tilted to the downside especially as Kuwait looks to add refineries in China, India and the Philippines. Nevertheless, oil prices may find near-term relief as Russian Energy Minister Alexander Novak notes that ‘third quarter will be fairly indicative because the demand will go up in this period,’ while the Energy Information Administration (EIA) is anticipated to show oil inventories contracting another 2850K in the week ending July 7. In turn, signs of greater consumption may help to limit the downside risk and alleviate the buildup in retail positioning as the IG Sentiment report shows 71.1% of traders are net-long with the ratio of traders long to short at 2.46 to 1.
USOIL Daily

Chart - Created Using Trading View
- The path of least resistance remains tilted to the downside as USOIL continues to operate within the descending channel, while the Relative Strength Index (RSI) preserves the bearish formation carried over from earlier this year; a close below the $44.90 (78.6% retracement) may open up the next region of interest around $42.90 (23.6% retracement) to $43.20 (78.6% expansion) followed by the 2017-low ($42.08).
- Nevertheless, USOIL may face range bound conditions as it fails to extend the series of lower highs & lows from the previous week, with a break/close above the $45.30 (23.6% expansion) hurdle raising the risk for a push back towards the monthly opening range.

Track Retail Sentiment with the New Gauge Developed by DailyFX Based on Trader Positioning
- Retail trader data shows 69.2% of traders are net-long USD/CAD with the ratio of traders long to short at 2.25 to 1. In fact, traders have remained net-long since June 07 when USD/CAD traded near 1.3481; price has moved 4.5% lower since then. The number of traders net-long is 4.1% higher than yesterday and 7.3% lower from last week, while the number of traders net-short is 25.3% higher than yesterday and 22.2% higher from last week.
- Retail trader data shows 43.8% of traders are net-long GBP/USD with the ratio of traders short to long at 1.28 to 1. In fact, traders have remained net-short since June 23 when GBP/USD traded near 1.2673; price has moved 1.7% higher since then. The number of traders net-long is 6.6% higher than yesterday and 21.1% higher from last week, while the number of traders net-short is 7.1% higher than yesterday and 14.1% lower from last week.
Click Here for the DailyFX Calendar
--- Written by David Song, Currency Analyst
To contact David, e-mail dsong@dailyfx.com. Follow me on Twitter at @DavidJSong.
To be added to David's e-mail distribution list, please follow this link.


