


Talking Points:
- USD/JPY Continues to Pullback From 104.20 Hurdle as BoJ Mulls Future of JGB Purchases.
- USD/CAD Pushes to Fresh Monthly High as Dismal Canada Data Fuels Bets for BoC Rate-Cut.

| Currency | Last | High | Low | Daily Change (pip) | Daily Range (pip) |
|---|---|---|---|---|---|
| USD/JPY | 103.93 | 104.2 | 103.52 | 2 | 68 |
USD/JPY Daily
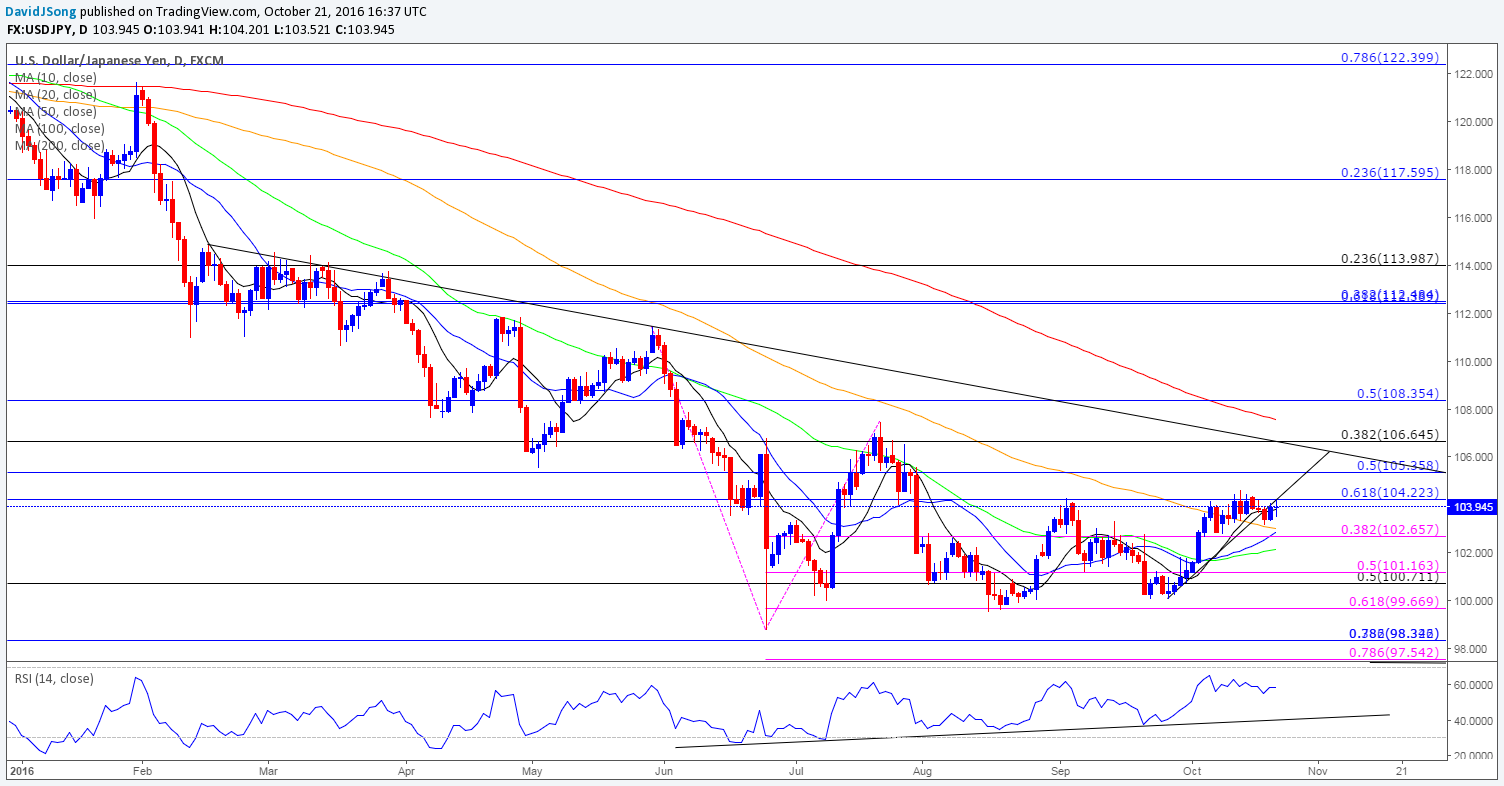
Chart - Created Using Trading View
- USD/JPY appears to be moving back towards the bottom of its recent range as the exchange rate continues to pullback from the 104.20 (61.8% retracement) hurdle, with the pair at risk for further losses as it fails to preserve the upward trend carried over from the previous month.
- It seems as though the Bank of Japan (BoJ) will preserve its current policy at the November 1 interest-rate decision as the central bank continues to assess the impact of the negative-interest rate policy (NIRP), but the quantitative and qualitative easing with ‘yield curve control’ program may eventually lead to smaller purchase down the road as Governor Haruhiko Kuroda warns ‘there may be some modification to our forecast that inflation will hit our 2 percent target during fiscal 2017,’ while former central bank official Sayuri Shirai argues that the new framework is in fact ‘implicit tapering.’
- Failed attempts to test the monthly high (104.64) may spark a move back towards the bottom of the near-term range around 102.70 (38.2% retracement), with the next downside region of interest coming in around 100.70 (50% retracement) to 101.20 (50% expansion).
| Currency | Last | High | Low | Daily Change (pip) | Daily Range (pip) |
|---|---|---|---|---|---|
| USD/CAD | 1.3332 | 1.3351 | 1.3226 | 102 | 125 |
USD/CAD Daily
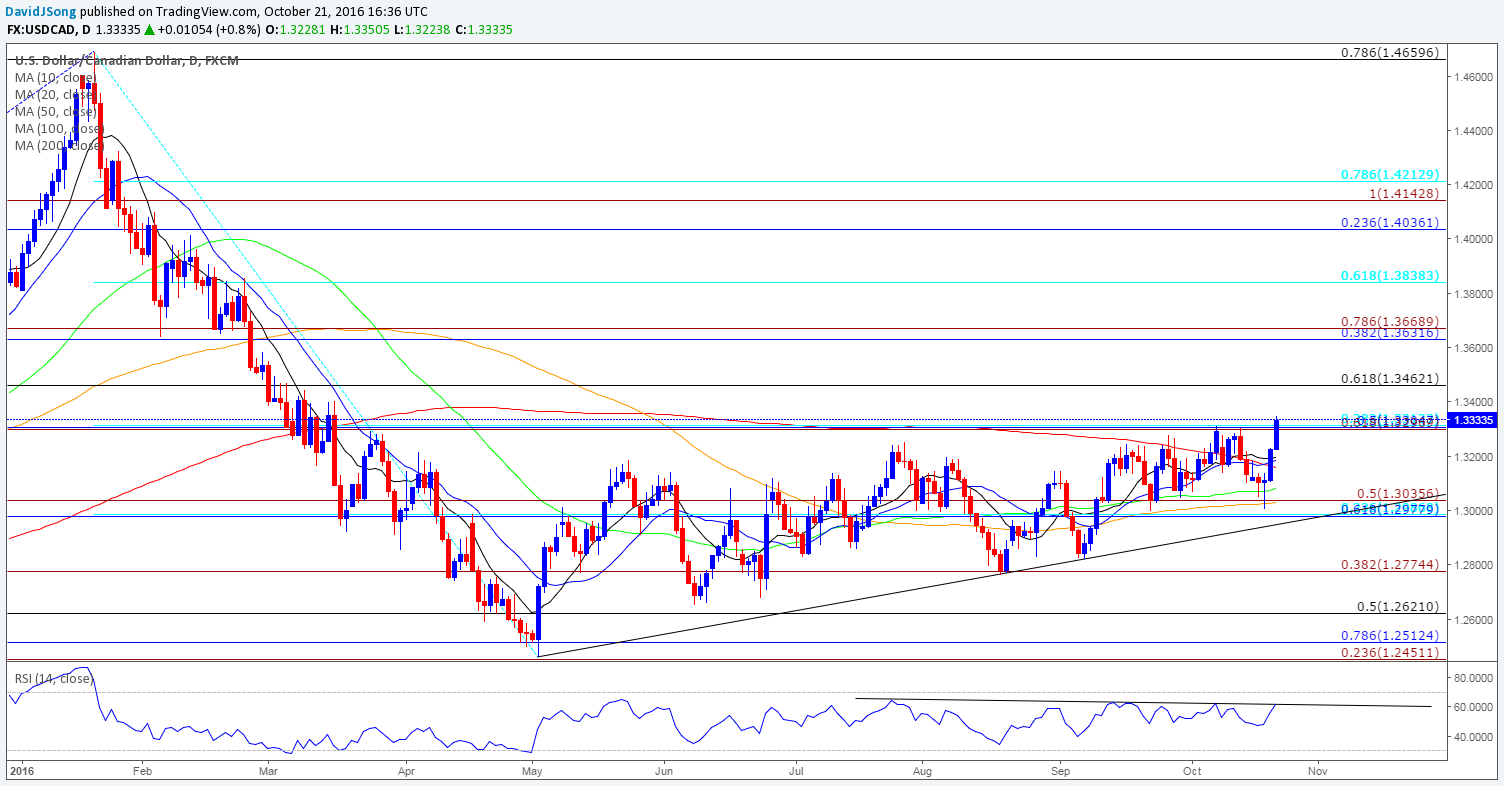
Chart - Created Using Trading View
- USD/CAD climbs to a fresh monthly high of 1.3351, with the pair at risk of a further advance as the slew of dismal data prints coming out of Canada fuel bets for additional monetary support; may see the Bank of Canada (BoC) continue to ‘actively’ discuss more stimulus for the real economy especially as the central bank now forecasts the economy to reach full-capacity ‘materially later than the Bank had anticipated in July.’
- With BoC Governor Stephen Poloz scheduled to appear in front of the House of Commons Standing Committee on Finance next week, the fresh rhetoric may further dampen the appeal of the Canadian dollar should the central bank head show a greater willingness to reestablish the easing cycle over the coming months.
- Closing price above the Fibonacci overlap around 1.3300 (50% retracement) to 1.3310 (38.2% retracement) pushes the focus to the next topside region of interest around 1.3460 (61.8% retracement), followed by 1.3630 (38.2% retracement) to 1.3670 (78.6% expansion).
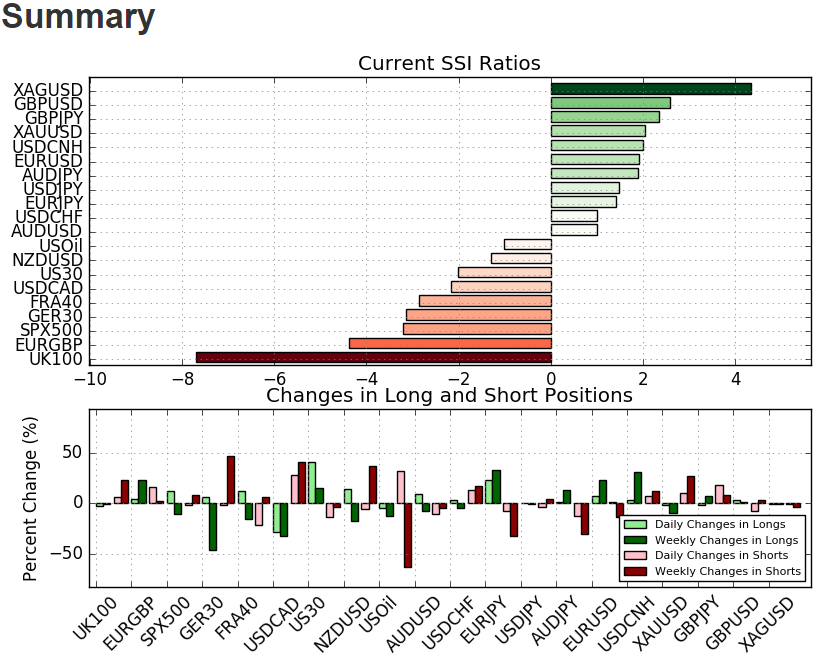
- The DailyFX Speculative Sentiment Index (SSI) shows the retail crowd remains net-long USD/JPY since July 21, with the ratio hitting a 2016 extreme of +6.03 in September, while traders flipped net-short USD/CAD ahead of the slew of Canadian data prints, with the crowd now stuck on the wrong side.
- USD/JPY SSI currently sits at +1.48 as 60% of traders are long, with long positions 5.0% higher from the previous week even as open interest stands 11.2% below the monthly average.
- USD/CAD SSI currently sits at -2.12 as 32% of traders are long, with short positions 50.2% higher from the previous week, while open interest stands a marginal 0.2% below the monthly average..
- May see USD/CAD SSI push further into negative territory as the retail crowd continues to fight the appreciation in the exchange rate and appear to be looking for range-bound conditions.
Why and how do we use the SSI in trading? View our video and download the free indicator here

Click Here for the DailyFX Calendar
Get our top trading opportunities of 2016 HERE
Read More:
COT-Speculative US Dollar Buying Frenzy
Earnings, ECB and Inflation to Headline Heavy Data Week
Silver Prices: Dead Cat Bounce Keeps Bias Tilted Lower
DAX Battle Lines Drawn as Index Looks to Regain 2016 Losses
--- Written by David Song, Currency Analyst
To contact David, e-mail dsong@dailyfx.com. Follow me on Twitter at @DavidJSong.
To be added to David's e-mail distribution list, please follow this link.


