


Talking Points:
- AUD/USD to Stage Larger Recovery on Wait-and-See RBA, Rebound in Retail Sales.
- GBP/USD Weighed by ‘Brexit’ Timeline; Retail Sentiment Approaches 2003 Extreme.

| Currency | Last | High | Low | Daily Change (pip) | Daily Range (pip) |
|---|---|---|---|---|---|
| AUD/USD | 0.7666 | 0.7681 | 0.7641 | 8 | 40 |
AUD/USD Daily
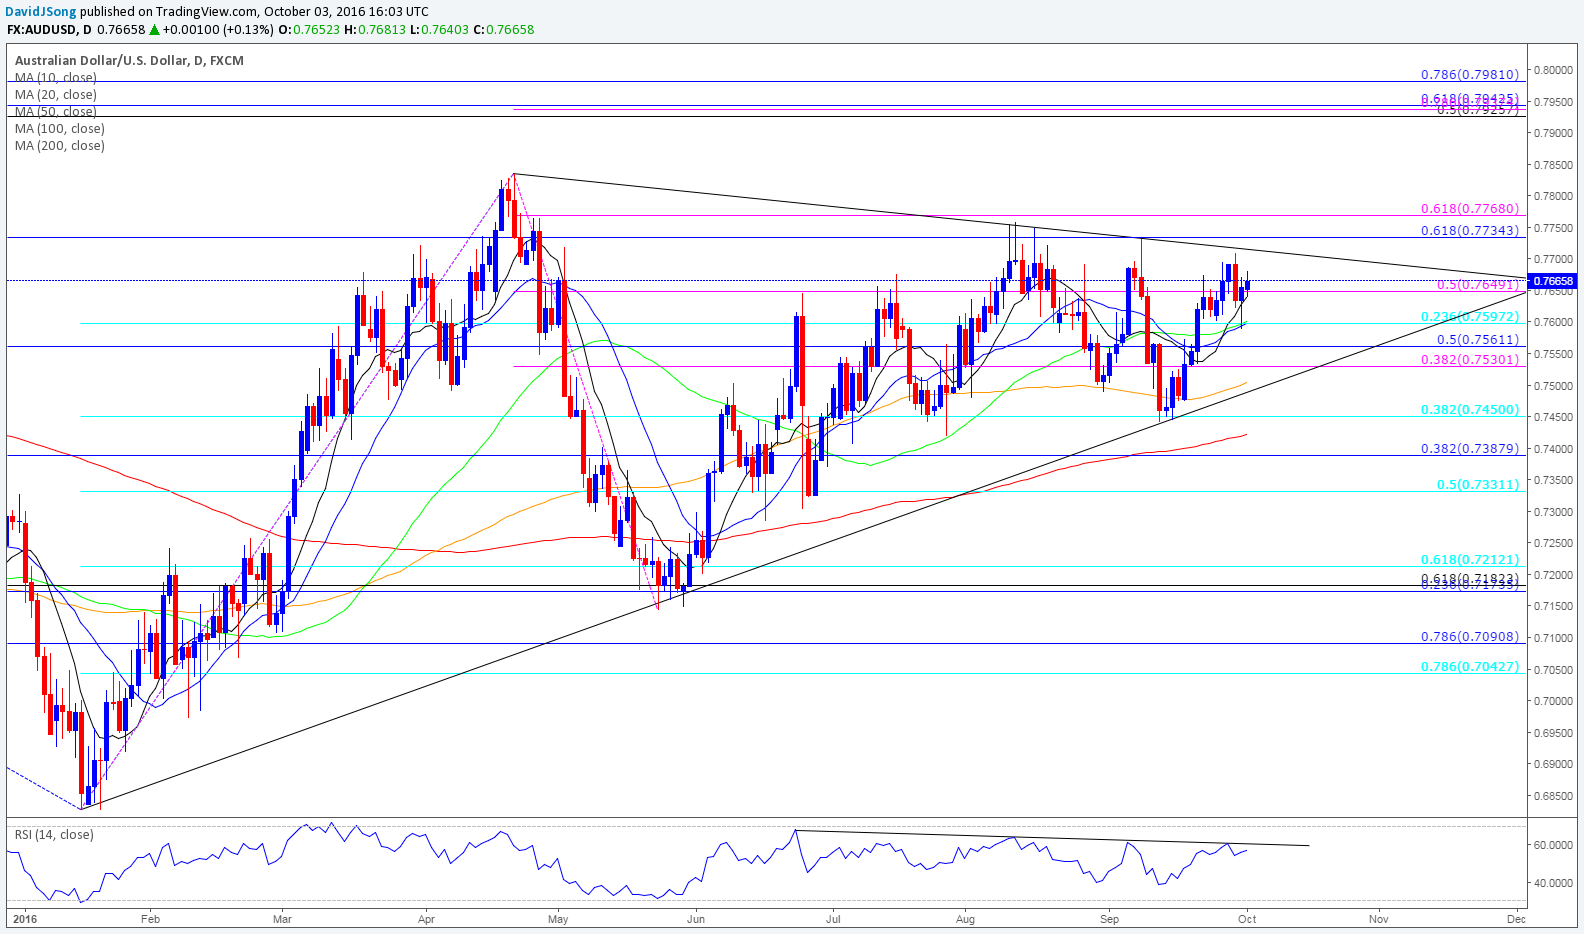
Chart - Created Using Trading View
- AUD/USD may stage a larger recovery as the Reserve Bank of Australia (RBA) is widely anticipated to keep the benchmark interest rate at the record-low of 1.50% in October, and the fresh comments from Governor Philip Lowe & Co. may boost the appeal of the higher-yielding currency should the central bank talk down expectations for lower borrowing-costs.
- The RBA may largely retain the verbal intervention on the Australian dollar as the resilience in the local currency dampens the outlook for inflation, but more of the same from the central bank accompanied by a rebound in Australia Retail Sales may encourage a topside break in the exchange rate as it remains stuck within the triangle/wedge formation carried over from earlier this year.
- Positive developments out of Australian may push AUD/USD back towards the September high (0.7731), with a break/close above 0.7740 (78.6% expansion) raising the risk for a test of the 2016 high (0.7834).
| Currency | Last | High | Low | Daily Change (pip) | Daily Range (pip) |
|---|---|---|---|---|---|
| GBP/USD | 1.2840 | 1.2953 | 1.2818 | 101 | 135 |
GBP/USD Daily
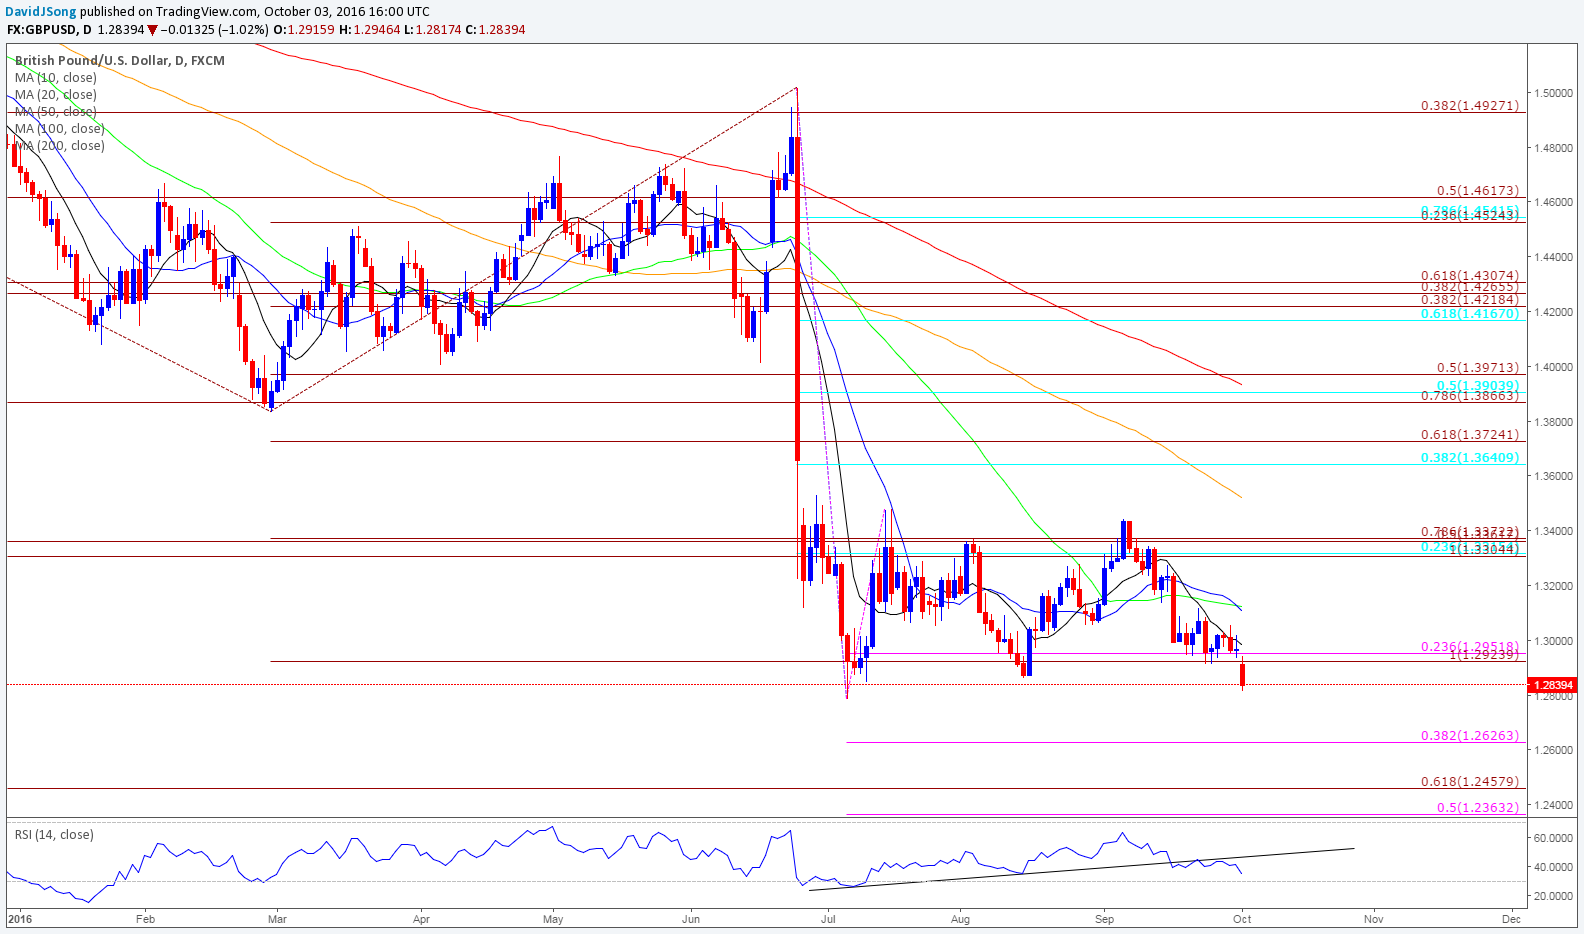
Chart - Created Using Trading View
- GBP/USD struggles coming into October as U.K. Prime Minister Theresa May pledges to invoke Article 50 of the Lisbon treaty by no later than the end of March 2017, with the sterling at risk of facing additional headwinds over the near to medium-term as the economic outlook for the region becomes increasingly clouded with high uncertainty; longer-term outlook for the sterling remains tilted to the downside especially as the region runs a Balance of Payments (BoP) deficit and remains reliant on international financing.
- It seems as though the Bank of England (BoE) will continue to embark on its easing cycle as ‘a majority of members expect to support a further cut in Bank Rate to its effective lower bound,’ but the bearish sentiment surrounding the sterling may abate over the remainder of the year especially as GovernorMark Carney rules out a zero-interest rate policy (ZIRP) for the U.K., with the central bank widely anticipated to endorse a wait-and-see approach at the next policy meeting on October 13.
- Failure to hold above the Fibonacci overlap around 1.2920 (100% expansion) to 1.2950 (23.6% expansion) raises the risk of seeing a test of the 2016 low (1.2788), with the next downside target coming in around 1.2630 (38.2% expansion) followed by 1.2460 (61.8% expansion).
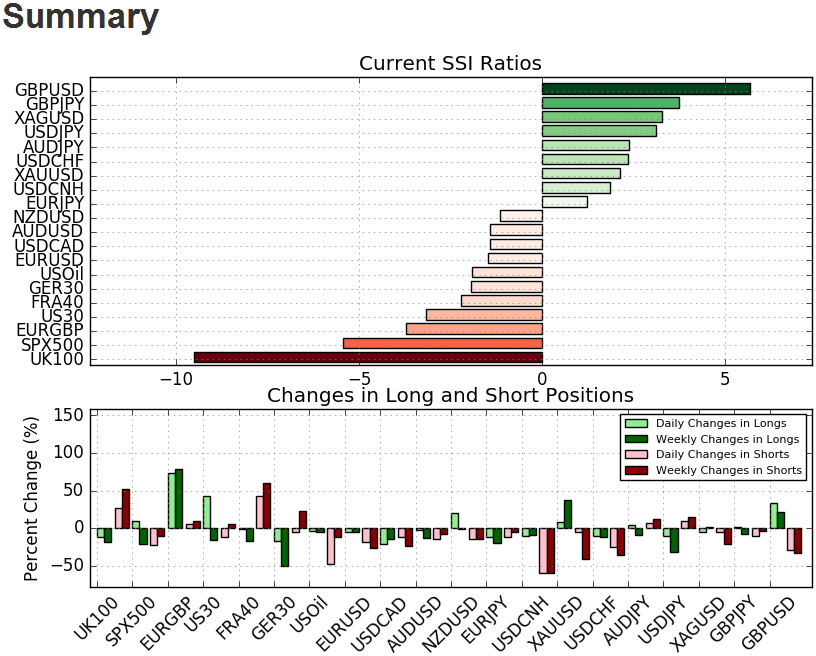
- The DailyFX Speculative Sentiment Index (SSI) shows the FX crowd remains net-short AUD/USD since September 21, while the ratio for GBP/USD is approaching the most extreme reading since 2003 as it pushes above the +5.00 mark.
- AUD/USD SSI currently sits at -1.48 as 40% of traders are long, with long positions 16.5% lower from the previous week as open interest stands 3.7% below the monthly average.
- GBP/USD SSI is at a whopping +5.21 as 84% of traders are long, with long positions 9.4% higher from the previous week, while open interest is 19.1% above the monthly average.
- With the FX crowd net-long GBP/USD since September 13, the ratio may continue to work its way towards the most extreme reading in over a decade as retail traders appear to be stuck on the wrong side of the market.
Why and how do we use the SSI in trading? View our video and download the free indicator here

Click Here for the DailyFX Calendar
Get our top trading opportunities of 2016 HERE
Read More:
COT-4th Most Selling by CAD Speculators Since at Least 2002
FTSE 100: Bull Pattern Breakout to Start Q4
FX Technical Weekly: Don’t Get Caught Fading the Next EUR/USD Move
USD/JPY Technical Analysis: Fault Lines Are Showing Favoring JPY
--- Written by David Song, Currency Analyst
To contact David, e-mail dsong@dailyfx.com. Follow me on Twitter at @DavidJSong.
To be added to David's e-mail distribution list, please follow this link.


