Talking Points:
- AUD/USD Outlook Turns Increasing Bearish Ahead of Australia Employment Report.
- USDOLLAR Stages Larger Recover Ahead of Retail Sales; Opening Monthly Range in Focus.
Avoid the pitfalls of trading by steering clear of classic mistakes. Review these principles in the "Traits of Successful Traders" series.
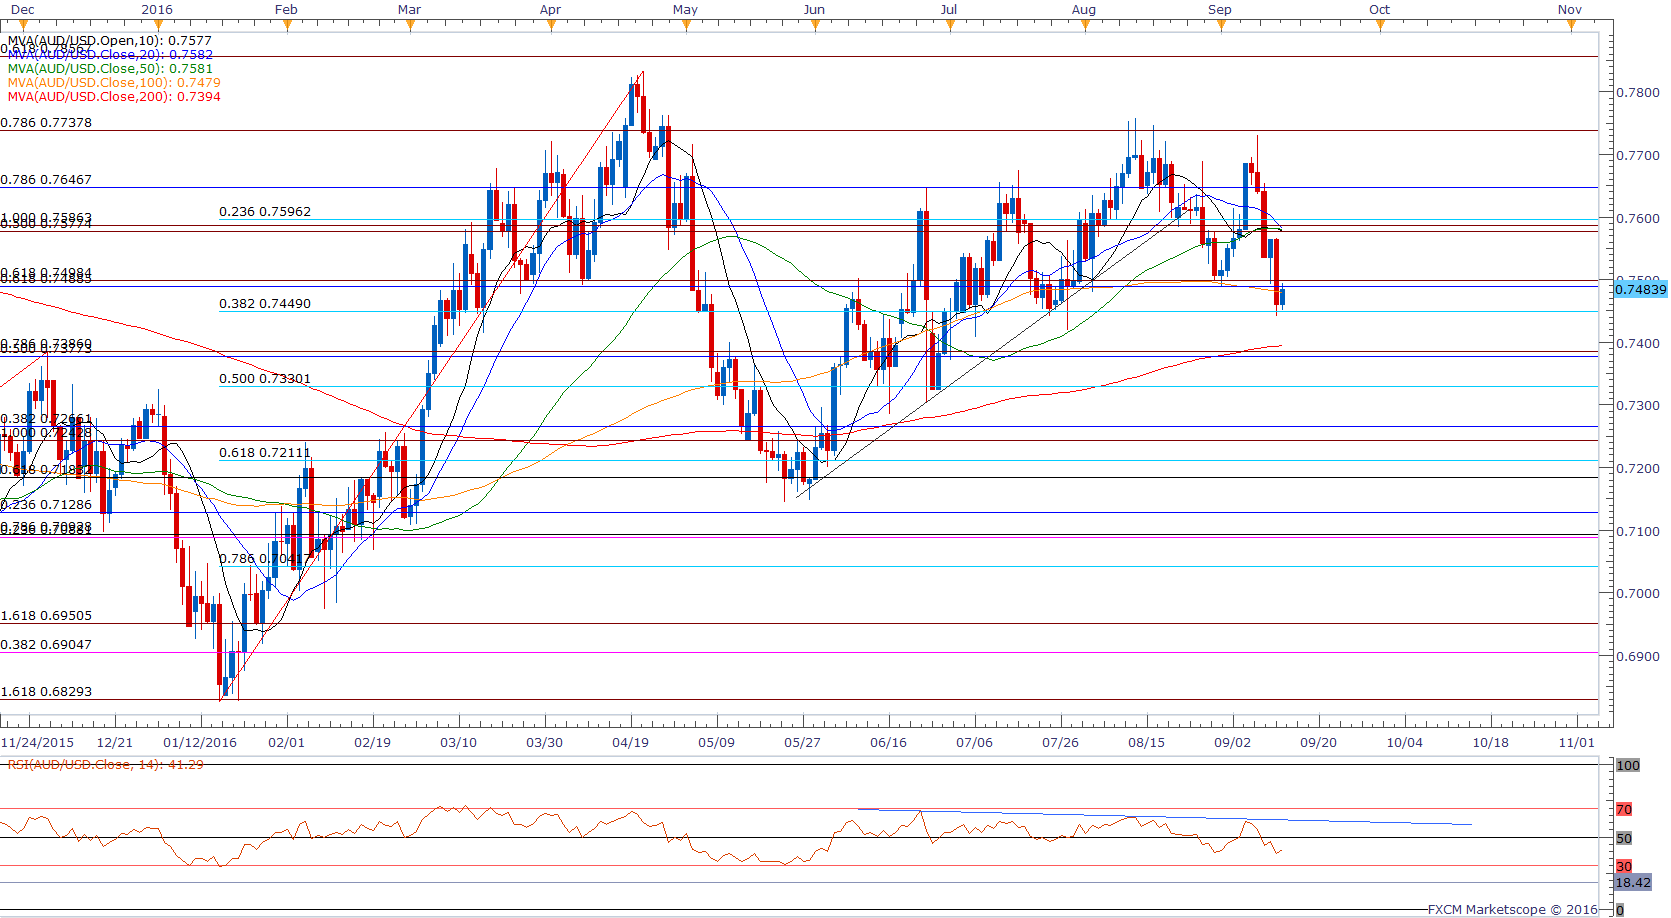
Chart - Created by David Song
- Even though Australia Employment is projected to increase another 15.0K in August, the broader outlook for AUD/USD is turning increasingly bearish as it fails to preserve the upward trend carried over from May, while a double-top formation appears to be taking shape following the failed test of the July high (0.7759).
- After cutting the benchmark interest rate to a fresh record-low of 1.50% in August, the Reserve Bank of Australia (RBA) may continue to endorse a wait-and-see approach at the next interest rate decision on October 4 as Philip Lowe takes over the helm, but the central bank may keep the door open to further embark on its easing cycle as the board anticipates the low-inflation environment to ‘remain the case for some time;’ may see market participants put increased emphasis on the 3Q Consumer Price Index (CPI), which is due out on October 26.
- A closing price below 0.7450 (38.2% retracement) may open up the next downside target around 0.7380 (50% retracement) to 0.7390 (78.6% expansion), which sits just below the 200-Day SMA (0.7394).

- In light of the recent decline in the exchange rate, the DailyFX Speculative Sentiment Index (SSI) shows the retail FX crowd has flipped net-long AUD/USD on September 9, with the ratio marking a 2016 extreme in January as it climbed to +2.50.
- The ratio currently sits at +1.35 as 58% of traders are long, with long positions 23.9% higher from the previous week, while open interest stands a marginal 0.6% above the monthly average.
- May see a further shift in retail positioning as AUD/USD appears to have carved a near-term top, with the pair at risk carving a bearish trend over the days ahead.
Why and how do we use the SSI in trading? View our video and download the free indicator here
USDOLLAR(Ticker: USDollar):
| Index | Last | High | Low | Daily Change (%) | Daily Range (% of ATR) |
|---|---|---|---|---|---|
| US Dollar Index | 11978.47 | 11996.55 | 11969.6 | -0.02 | 49.07% |

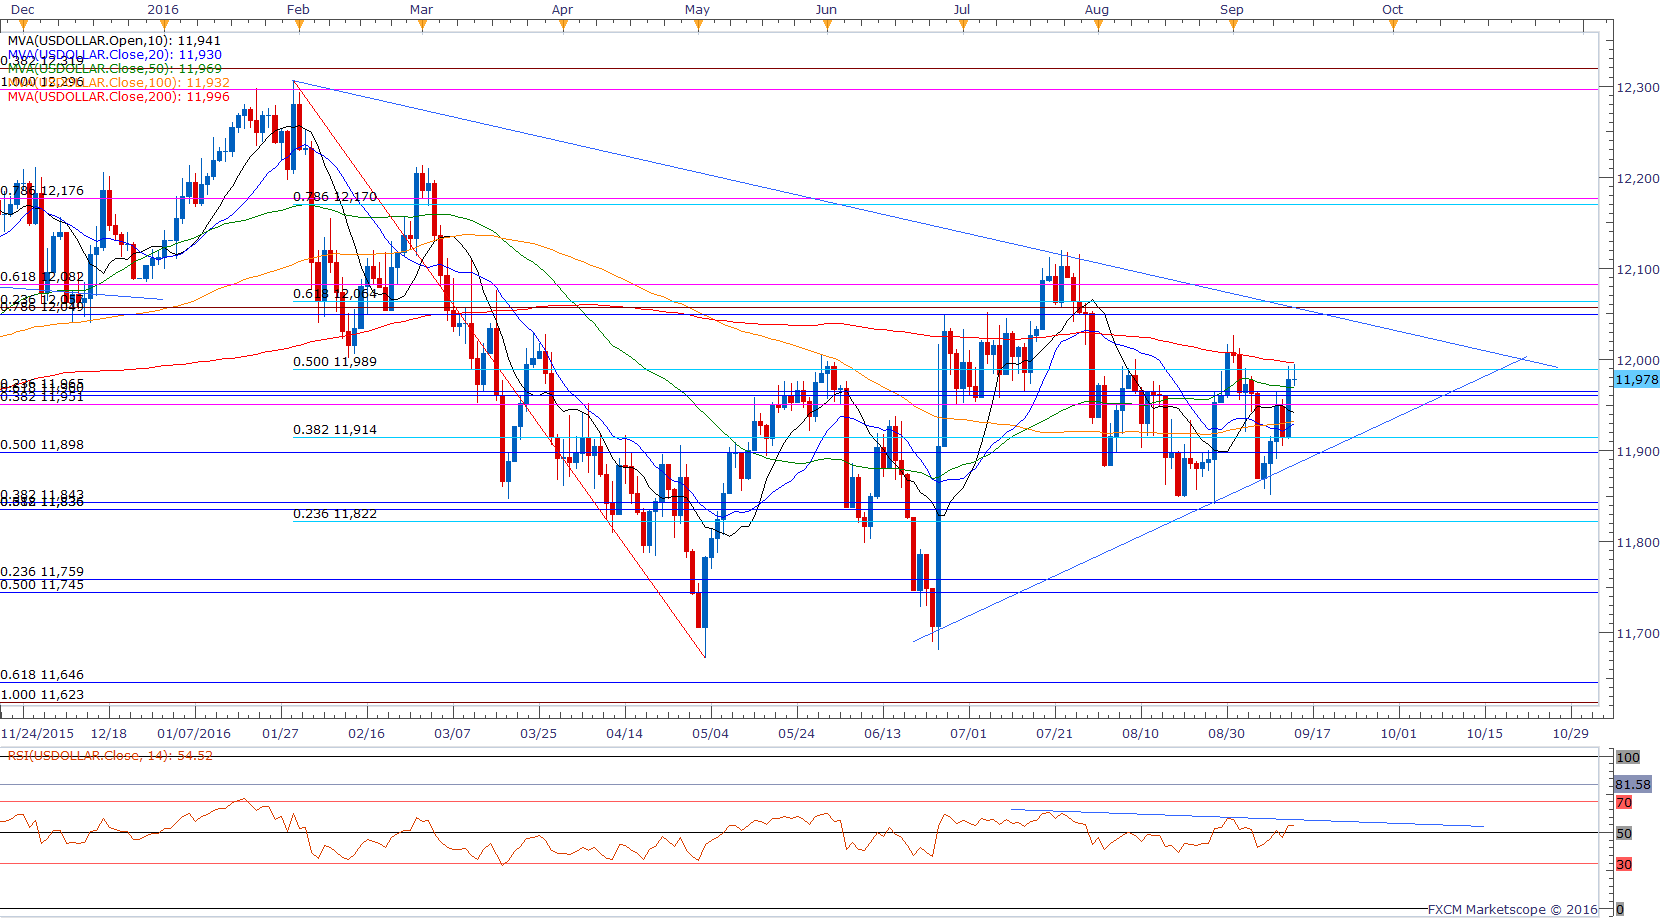
Chart - Created by David Song
- With the USDOLLAR pushing to a fresh weekly high, will keep close eye on the Relative Strength Index (RSI) as it approaches trendline resistance; a bullish break in the oscillator may foreshadow a larger advance for the greenback especially following the close above the Fibonacci overlap around 11,951 (38.2% retracement) to 11,965 (23.6% retracement).
- However, a marked slowdown in U.S. Advance Retail Sales may produce near-term headwinds for the greenback as Fed Funds Futures currently highlight a 15% probability for a September rate-hike; may see the Federal Open Market Committee (FOMC) follow a similar path to 2015 as the central bank struggles to achieve its 2% target for inflation.
- Failure to break/close above the 200-Day SMA (11.997) may ultimately turn out to be an unsuccessful test of the September high (12,013), which may spur a similar reaction to earlier this month, with the USDOLLAR at a risk for a further consolidation.
Click Here for the DailyFX Calendar
Get our top trading opportunities of 2016 HERE
Read More:
S&P 500: Standing Head-and-Shoulders Above the Rest?
Risk Starts Week Lower as USD, JPY Gain Traction
DAX: Wobbles on ECB, Trend-line Comes into Focus
NZD/USD 2016 Rally at Risk Sub-7500 as Sentiment Stretches
--- Written by David Song, Currency Analyst
To contact David, e-mail dsong@dailyfx.com. Follow me on Twitter at @DavidJSong.
To be added to David's e-mail distribution list, please follow this link.