


Talking Points:
- NZD/USD Continues to Carve Lower-Highs Ahead of RBNZ Update.
- USDOLLAR Extends Advance; Existing Home Sales on Tap.
Avoid the pitfalls of trading by steering clear of classic mistakes. Review these principles in the "Traits of Successful Traders" series.
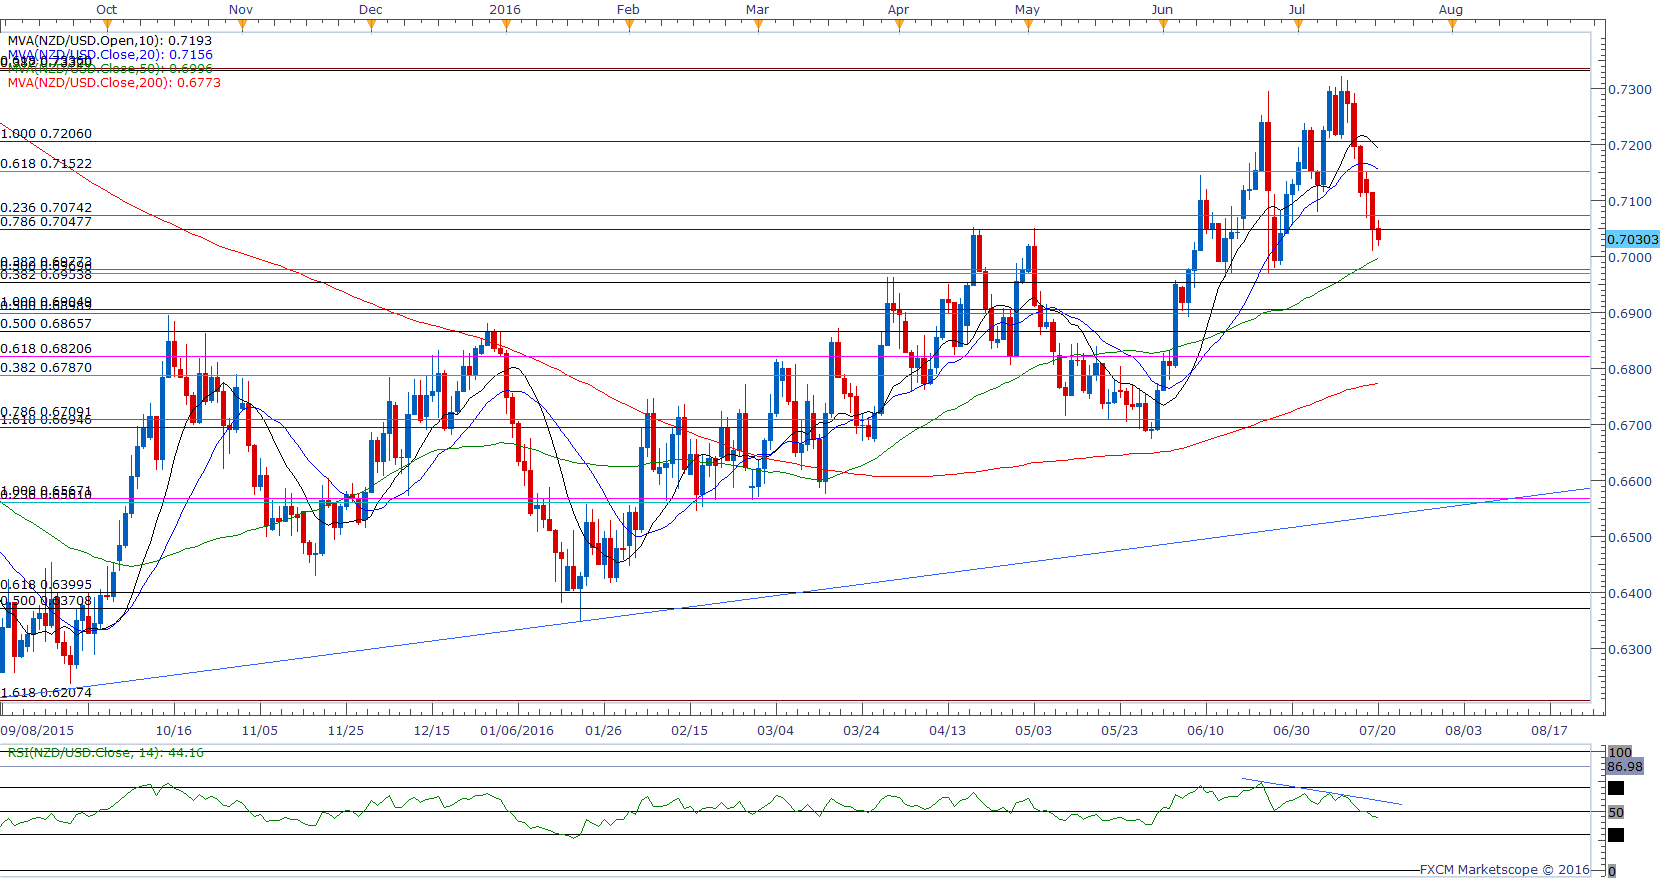
Chart - Created by David Song
- Following the failed attempts to test the Fibonacci overlap around 0.7330 (38.2% retracement) to 0.7340 (61.8% expansion), NZD/USD stands at risk for a larger pullback amid the recent string of lower-highs in the exchange rate, while the Relative Strength Index (RSI) continues to carve a bearish formation.
- With the Reserve Bank of New Zealand (RBNZ) scheduled to release its updated forecasts ahead of the next interest-rate decision on August 11, the weaker-than-expected 2Q Consumer Price Index (CPI) print may encourage the central bank to adopt a more cautious tone for the economy as the outlook for global growth becomes increasingly clouded with uncertainty.
- Next downside region of interest comes in around 0.6950 (38.2% retracement) to 0.6980 (38.2% expansion) followed by former resistance around 0.6890 (50% expansion) to 0.6900 (100% expansion).
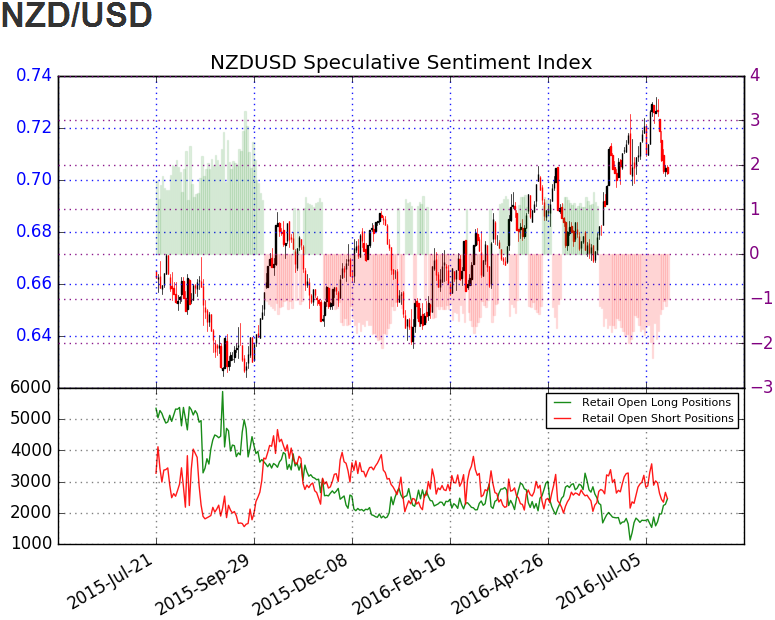
- The DailyFX Speculative Sentiment Index (SSI) shows the retail crowd has flipped back net-short NZD/USD on July 19, with the ratio hitting a near-term extreme earlier this month as it slid to -2.25.
- The ratio currently sits at -1.21 as 45% of traders are long, with long positions 30.2% higher from the previous week, while open interest stands 6.5% above the monthly average.
Why and how do we use the SSI in trading? View our video and download the free indicator here
USDOLLAR(Ticker: USDollar):
| Index | Last | High | Low | Daily Change (%) | Daily Range (% of ATR) |
|---|---|---|---|---|---|
| US Dollar Index | 12095.30 | 12114.26 | 12085.84 | 0.05 | 51.32% |

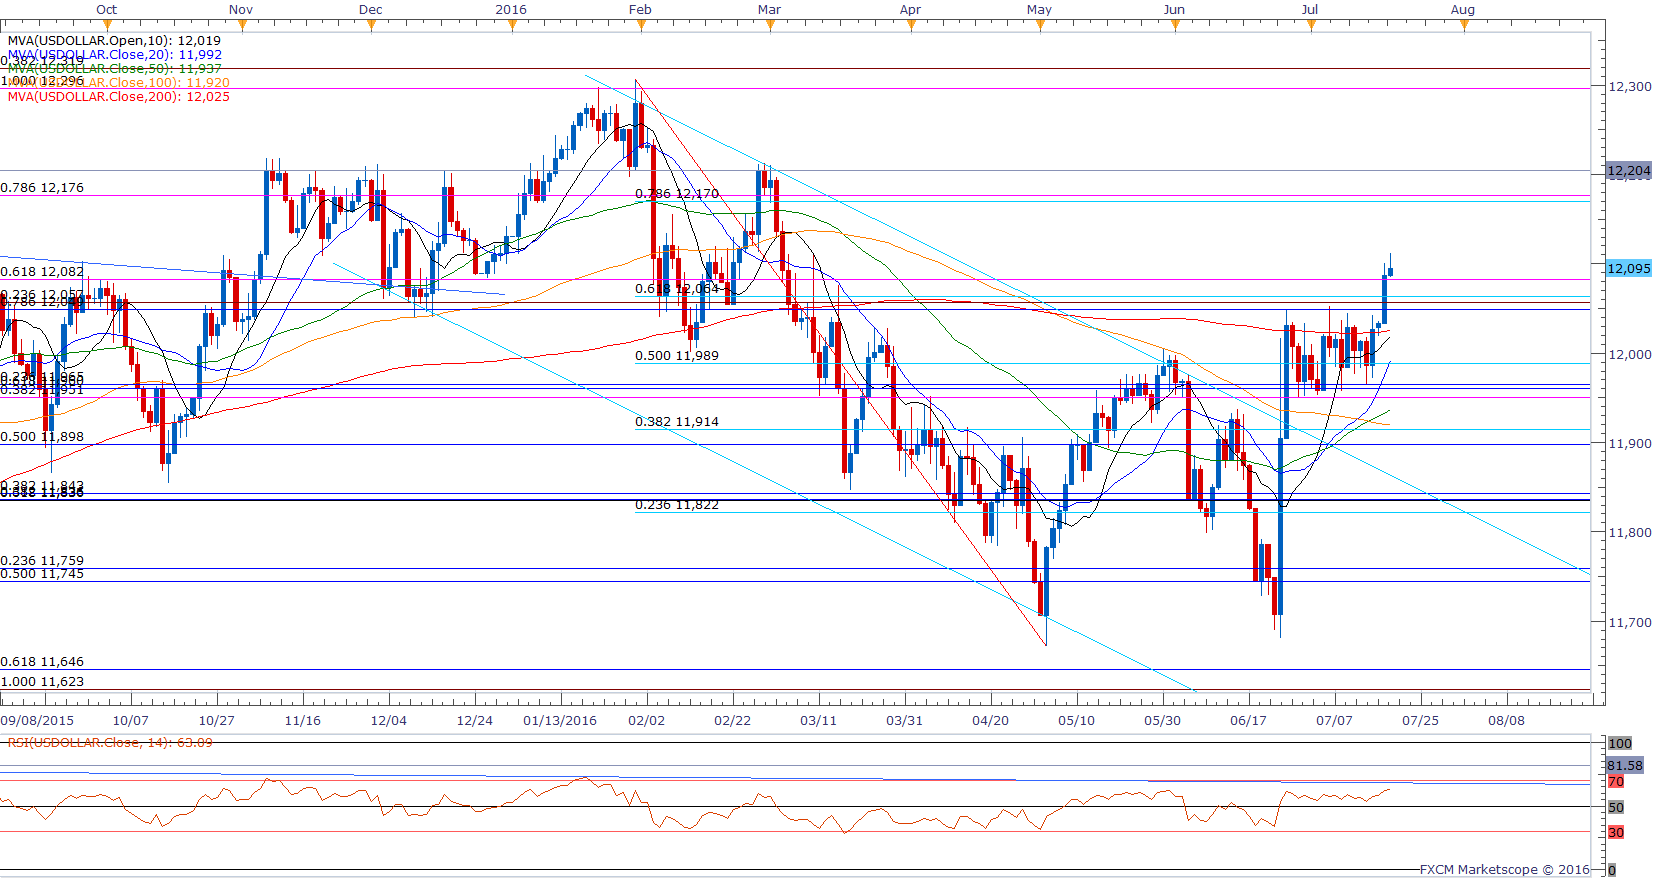
Chart - Created by David Song
- The near-term breakout in the USDOLLAR may gather pace over the coming days as the greenback starts to carve a series of higher highs & lows; will keep a close eye on the Relative Strength Index (RSI) as it approaches overbought territory.
- May see second-tier data coming out of the U.S. economy curb the near-term advance in the greenback as Existing Home Sales are projected to contract 0.9% in June, but may see growing demand for USD-denominated assets especially as the International Monetary Fund (IMF) lowers its outlook for global growth.
- Following the close above 12,049 (78.6% retracement) to 12,064 (61.8% retracement), will retain a constructive outlook for USDOLLAR, with the next topside target coming in around 12,170 (78.6% retracement) to 12,176 (78.6% expansion).

Click Here for the DailyFX Calendar
Get our top trading opportunities of 2016 HERE
Read More:
S&P 500: Suspended in Air, Turning to Hourly Chart for Clarity
USD/CHF Technical Analysis: Bullish but Beware the Wedge
Trading NZD/USD? Watch this Level in Lumber
--- Written by David Song, Currency Analyst
To contact David, e-mail dsong@dailyfx.com. Follow me on Twitter at @DavidJSong.
To be added to David's e-mail distribution list, please follow this link.


