


Talking Points:
- AUD/USD Bullish RSI Formation Falters Despite Wait-and-See RBA; Price to Follow Suit?
- USDOLLAR Eyes Topside Targets Following Range Break.
Avoid the pitfalls of trading by steering clear of classic mistakes. Review these principles in the "Traits of Successful Traders" series.

Chart - Created by David Song
- AUD/USD may continue to give back the advance from the end of May following the series of failed attempts to close above 0.7650 (78.6% retracement), while the Relative Strength Index (RSI) breaks down from the bullish formation.
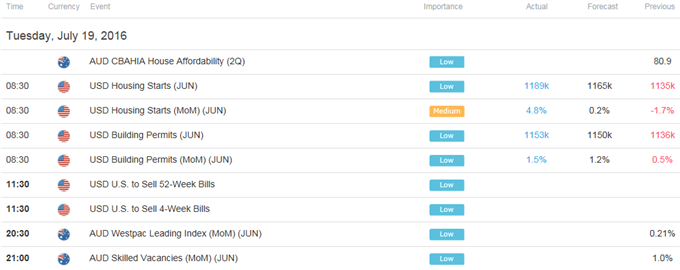
- With the Reserve Bank of Australia (RBA) Minutes putting increased emphasis on the data prints coming out of ahead of the next interest-rate decision on August 2, the 2Q Consumer Price Index (CPI) report due out next week play heavily influence near-term price action along with the outlook for monetary policy as the central bank warns inflation is ‘to remain quite low for some time given very subdued growth in labour costs and very low cost pressures elsewhere in the world.’
- Will keep a close eye on the 0.7450 (38.2% retracement) region as it lines up with trendline support, with a break below the key juncture opening up the next downside target around 0.7380 (50% retracement) to 0.7390 (78.6% expansion).
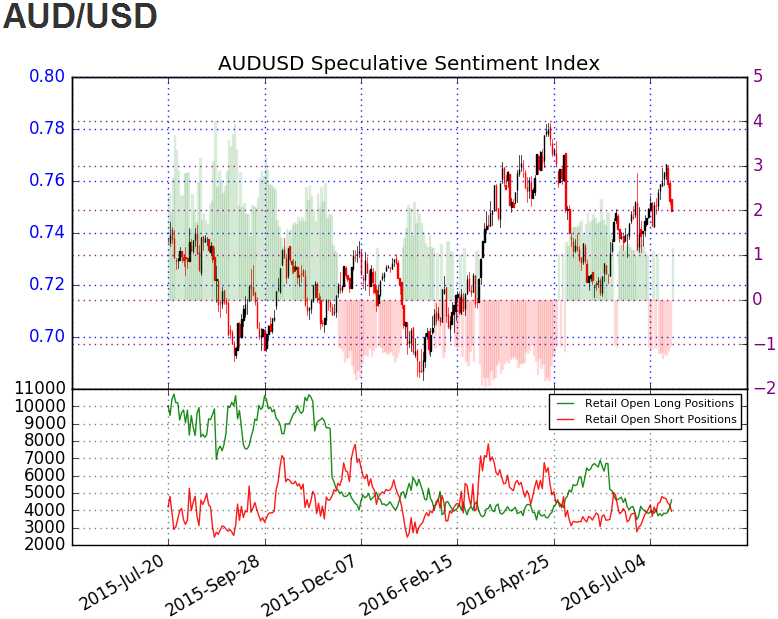
- The DailyFX Speculative Sentiment Index (SSI) shows the retail crowd has flipped back net-long AUD/USD earlier this morning, with the ratio hitting an extreme back in May as it climbed to +2.15.
- The ratio currently sits at +1.11 as 53% of traders are long, with long positions 23.1% higher from the previous week, while open interest stands 9.2% above the monthly average.
Why and how do we use the SSI in trading? View our video and download the free indicator here
USDOLLAR(Ticker: USDollar):
| Index | Last | High | Low | Daily Change (%) | Daily Range (% of ATR) |
|---|---|---|---|---|---|
| US Dollar Index | 12092.53 | 12101.75 | 12034.54 | 0.48 | 95.28% |
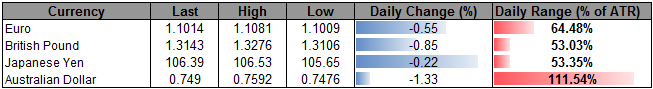

Chart - Created by David Song
- Despite the limited market reaction to the better-than-expected U.S. Housing Starts & Building Permits report, the ongoing easing cycle in Europe as well as in the Asia-Pacific region may fuel a larger advance in the USDOLLAR as it breaks out of the narrow range carried over from the previous month.
- However, the Federal Open Market Committee’s (FOMC) reluctance to raise the benchmark interest rate in 2016 may ultimately produce a bumpy path for the greenback as market participants see a growing risk of seeing a further delay in the normalization cycle.
- A closing price above 12,049 (78.6% retracement) to 12,064 (61.8% retracement) puts the focus on the next topside region of interest coming in around 12,170 (78.6% retracement) to 12,176 (78.6% expansion).
Click Here for the DailyFX Calendar
Get our top trading opportunities of 2016 HERE
Read More:
S&P 500: Suspended in Air, Turning to Hourly Chart for Clarity
USD/CHF Technical Analysis: Bullish but Beware the Wedge
Trading NZD/USD? Watch this Level in Lumber
--- Written by David Song, Currency Analyst
To contact David, e-mail dsong@dailyfx.com. Follow me on Twitter at @DavidJSong.
To be added to David's e-mail distribution list, please follow this link.


