


Talking Points:
- As we move towards the close of what’s been an active week towards the end of a busy year, we take a step back to look at the bigger pictures behind the Euro and U.S. Dollar.
- if you’re looking for more setup-related information after this weeks’ flurry of events, we looked into those in yesterday’s webinar entitled, Post FOMC, ECB, BoE Price Action Setups.
- If you’re looking for big picture trade ideas or education, please check out our Trading Guides. And if you’re looking for shorter-term ideas, our IG Client Sentiment indicator can help.
To receive James Stanley’s Analysis directly via email, please sign up here
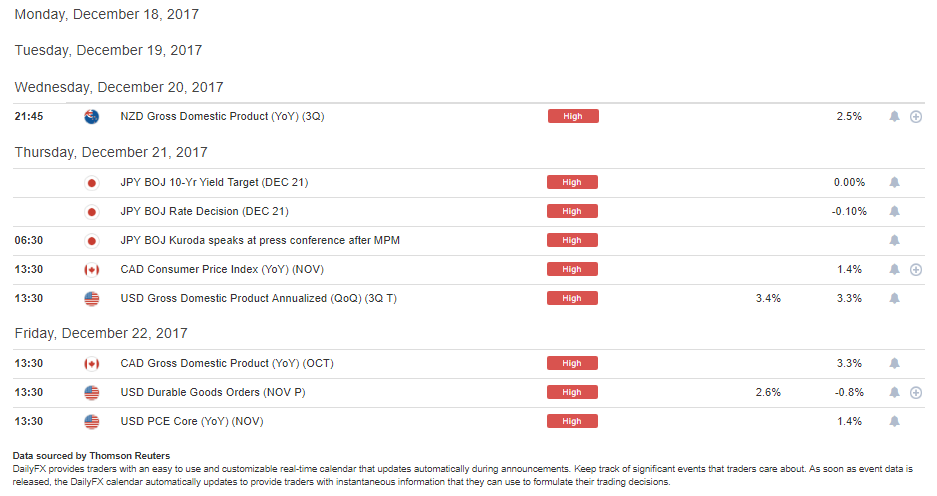
The past couple of weeks have been fairly full of data and drivers, but next week slows a bit ahead of the Christmas holiday taking place in the week after. Next week’s calendar is back-loaded, as we have no high-impact events until Wednesday evening when we get New Zealand GDP. Later Wednesday night/ early-Thursday in Asia brings a Bank of Japan interest rate decision; and then a couple of data highlights out of Canada and the United States close the week with prints on Thursday and Friday morning.
DailyFX Economic Calendar: Next Week is Back-Loaded, a Bit Slower From the Past Two Weeks
prepared by James Stanley
Perhaps the biggest take-away from this week was re-ignition of U.S. Dollar weakness after the Federal Reserve hiked rates for the third time this year. This week’s rate hike was long-telegraphed and there were minimal expectations for anything outside of a 25 basis point move. The Fed upgraded projections around GDP, unemployment and inflation; but the one thing that remained untouched was the bank’s expectation for three rate hikes next year. This was seen as a dovish twist, and traders sold out of the U.S. Dollar in the immediate aftermath after DXY had run into resistance earlier in the morning.
U.S. Dollar via ‘DXY’ Four-Hour: Fall From Resistance on Wednesday’s U.S. CPI, FOMC
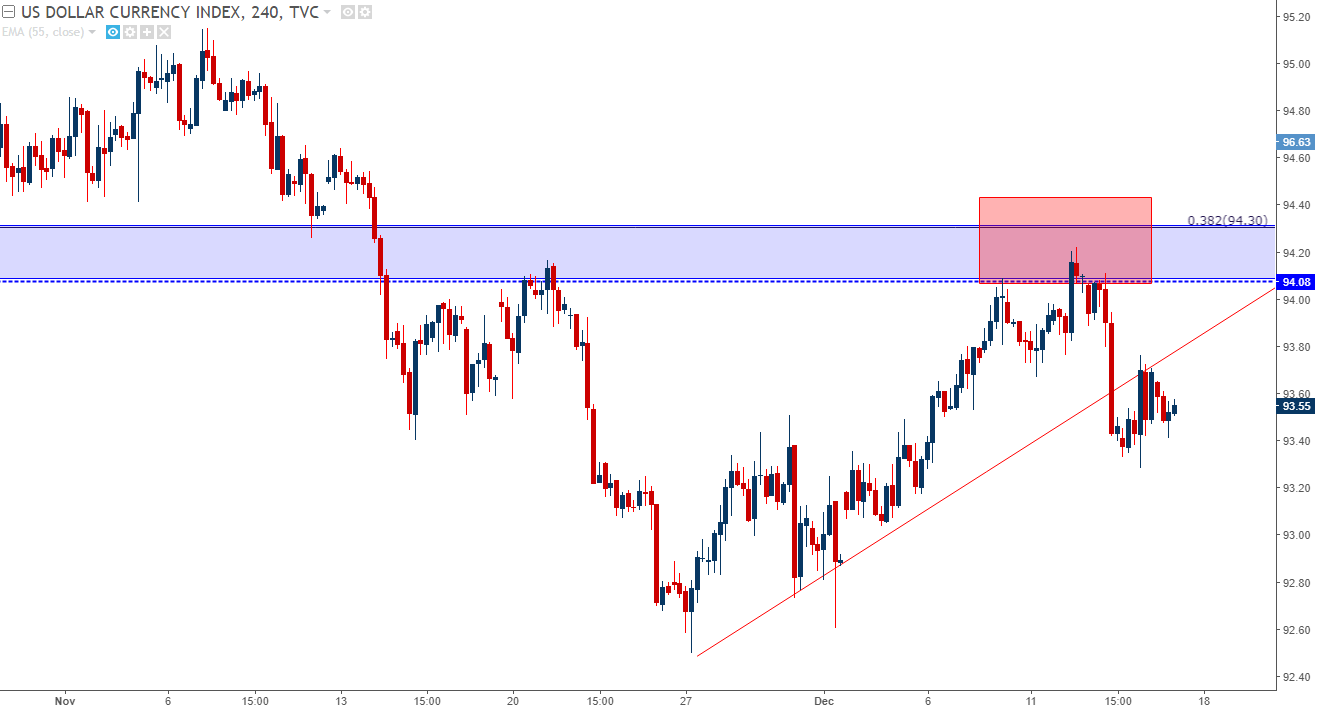
Chart prepared by James Stanley
This continues the nasty turn of events for USD-bulls that’s taken place throughout this year. The Dollar came into 2017 riding high on the wave of the ‘reflation trade’. That turned-around pretty quickly, and by the time we got to the Fed’s March rate hike, the Dollar had already made a bearish turn. That theme of weakness lasted into the summer, at which point the move began to hasten just a couple of weeks after the Fed’s June rate hike.
The aggressively bearish USD-trend lasted all the way into September. A low was set on September 8th, and this took place around the 50% retracement of the 2014-2017 move in USD. Since then – prices have continued to respect that low, and Q4, so far, has been the first quarter of the year when USD did not set a fresh near-term low.
U.S. Dollar via ‘DXY’ Daily: 2017 Down-Trend, Bearish Channel Finds Respite in Q4 (in Grey)

Chart prepared by James Stanley
As we move into 2018, few are expecting any changes of pace here. After all, USD-weakness has been fairly profound this year and this is even with the backdrop of a hawkish Federal Reserve. But – few probably would have expected just how weak the Dollar would be this year after as we came into 2017 riding those 14-year highs; and by looking at longer-term charts, there is a case to be made for a stronger Dollar at some point next year.
On the weekly chart below, we’re adding some context to this year’s bearish channel in the U.S. Dollar. We’ve also added a Fibonacci retracement over the 2014-2017 major move to illustrate how the 50% marker of that move helped to set this year’s low. Given that prices continued to respect that marker, there is an argument for bullish continuation. This would be highlighted by the fact that this year could be seen as digestion of that bigger-picture, longer-term move. A bullish break above 95.17 would also amount to a bullish break of the bearish channel as well as the 38.2% retracement of this same move. That can open the door for a re-test of the 23.6% retracement at 97.94.
U.S. Dollar via ‘DXY’ Weekly: Bigger Picture Highlights 2017 as Correction to Longer-Term Trend
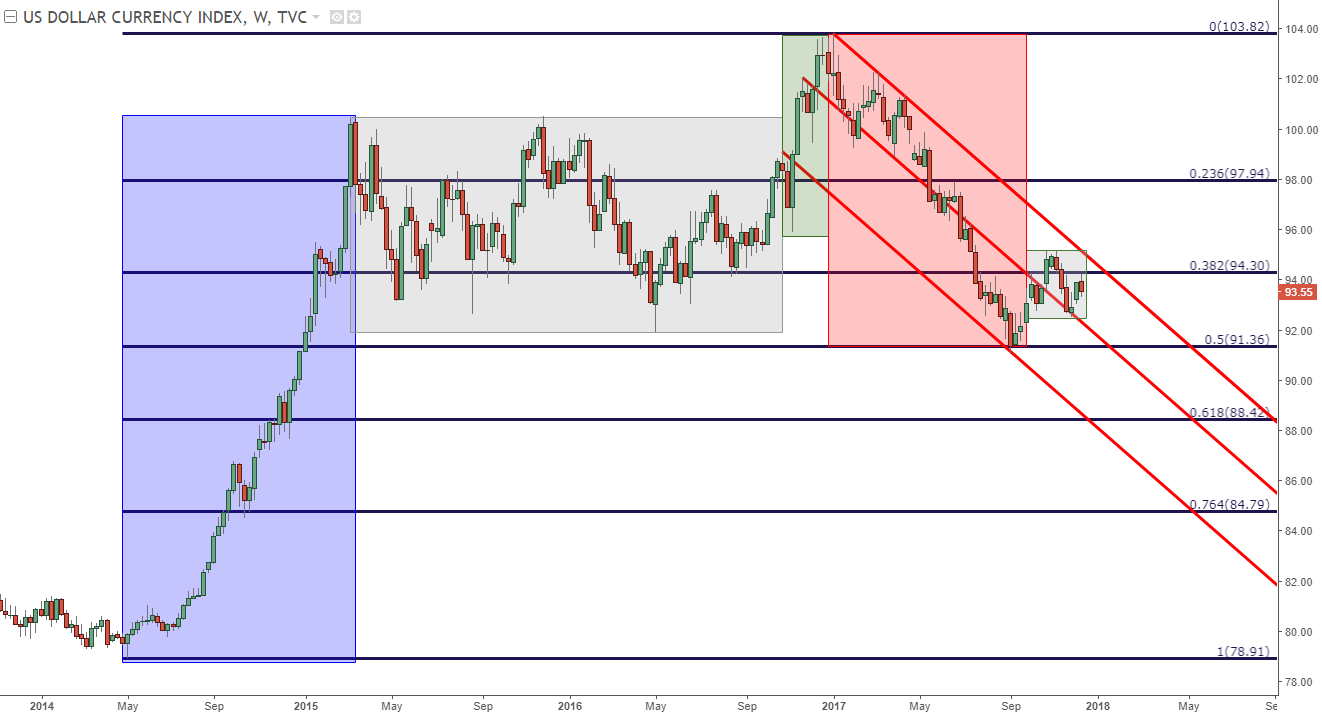
Chart prepared by James Stanley
Also of note from the past week was the European Central Bank rate decision that took place on Thursday. This was the first ECB meeting since the bank extended their stimulus program in October; and as has become par for the course, the ECB appeared to be very dovish concerning near-term policy moves. The underlying expectations, however, remain positive; as the ECB upgraded their inflation expectation for next year up to 1.4% from the prior 1.2%.
This year’s price action in the Euro has been very dichotomous with what the European Central Bank has been saying. The ECB has been very dovish for most of the year, appearing to be rather umoved by the improving backdrop that’s been seen in the European economy. Nonetheless, throughout the year, the bank continued to say that they weren’t ready to exit stimulus nor where they at the point where they wanted to look at higher rates.
That didn’t stop markets from trying to get in-front of any potential stimulus exit out of the ECB. In April, after the first round of French elections resolved with a rather market-friendly outcome, the Euro gapped higher and never looked back. This was when EUR/USD was trading in the 1.08’s, and just five months later we were testing the psychological level at 1.2000. This included a break above a big, confluent zone of support/resistance that runs from 1.1685-1.1736. This zone provided support for EUR/USD for the better part of three months, and this didn’t give way until the October ECB rate decision in which the bank extended their stimulus program. This finally elicited a bearish break and for the first time since March, we had fresh lows in EUR/USD.
EUR/USD Daily: Support Break After October ECB Rate Decision
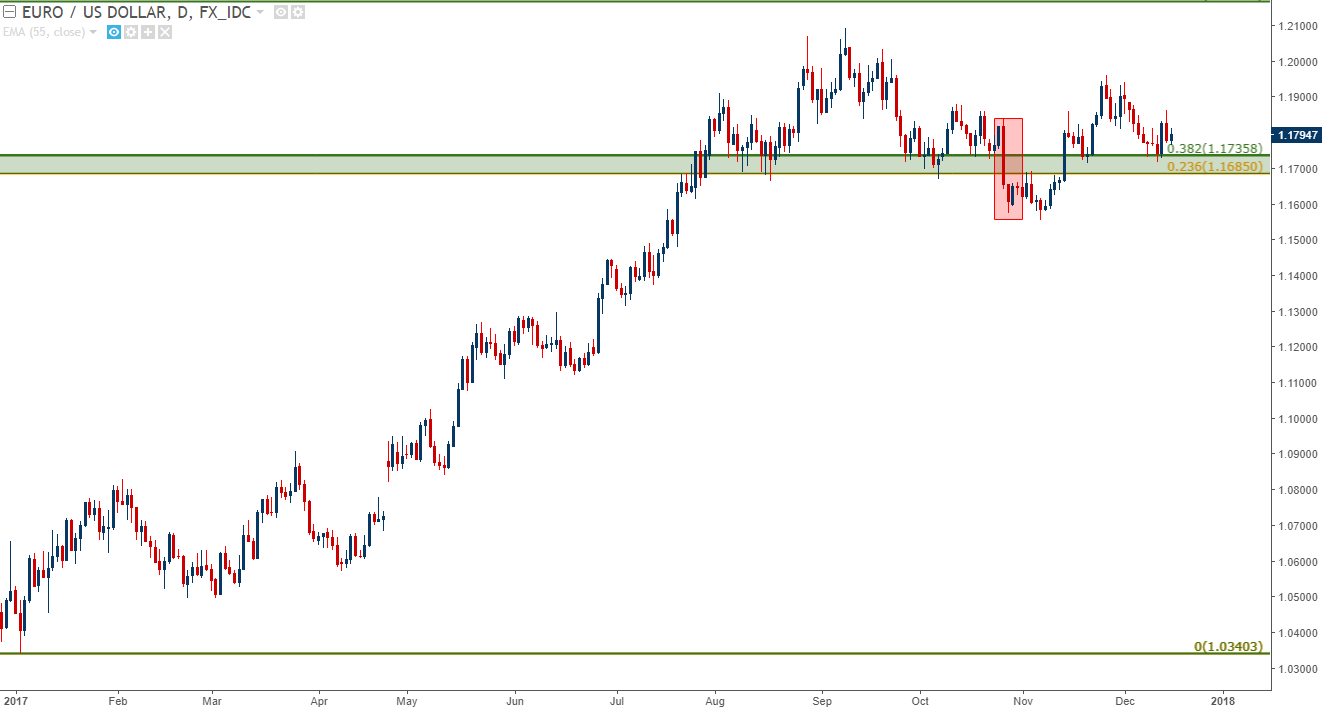
Chart prepared by James Stanley
That weakness lasted for all of a couple of weeks. In mid-November, a red-hot GDP report out of Germany highlighted the fact that Europe is on pace to grow faster than the United States this year. And while the Fed has now hiked rates five times in two years, the ECB remains loose and passive after having just extended their QE program for another nine months. If this global growth story is to continue – the ECB may have some catching up to do next year.
In short order, prices had popped back-above this key support zone; and this week saw another test of that area as a short-term higher-low.
As we move into 2018, the big question, of course, is whether this trend can continue. Given the heavy allocation of the Euro into ‘DXY’ (approximately 57.6%), the argument can be made that it’s unlikely to see both exhibit break-away strength at the same time.
If we do see Euro strength continue under the presumption that the ECB will eventually be pushed towards tighter policy options, then we’re likely going to see a continuation of this move in EUR/USD up to towards the 1.3000 psychological level. If we don’t, and if the Euro displays some element of weakness in the early portion of next year, we’ll likely see a return of USD-strength, by some metric, to break this year’s bearish trend.
2018 is setting up to be an incredibly exciting year across markets, and the center of the FX market is primed for some further development, in one way or the other. While it can be easy to move-forward under the assumption that the same old thing will continue to happen in the same old ways, 2017 should illustrate just how uncertain the future really is. Those 14-year highs in the Dollar broke down after just the second trading day of the year; while the runaway Euro strength was something that caught pretty much everyone by surprise. This is why we follow price action, to get clued in on these events at the early stage with the aim of turning these themes into trade-able ideas.
EUR/USD Monthly: 2017 Recover Finds Support at 23.6% of 2008-2017, 38.2% of 2014-2017
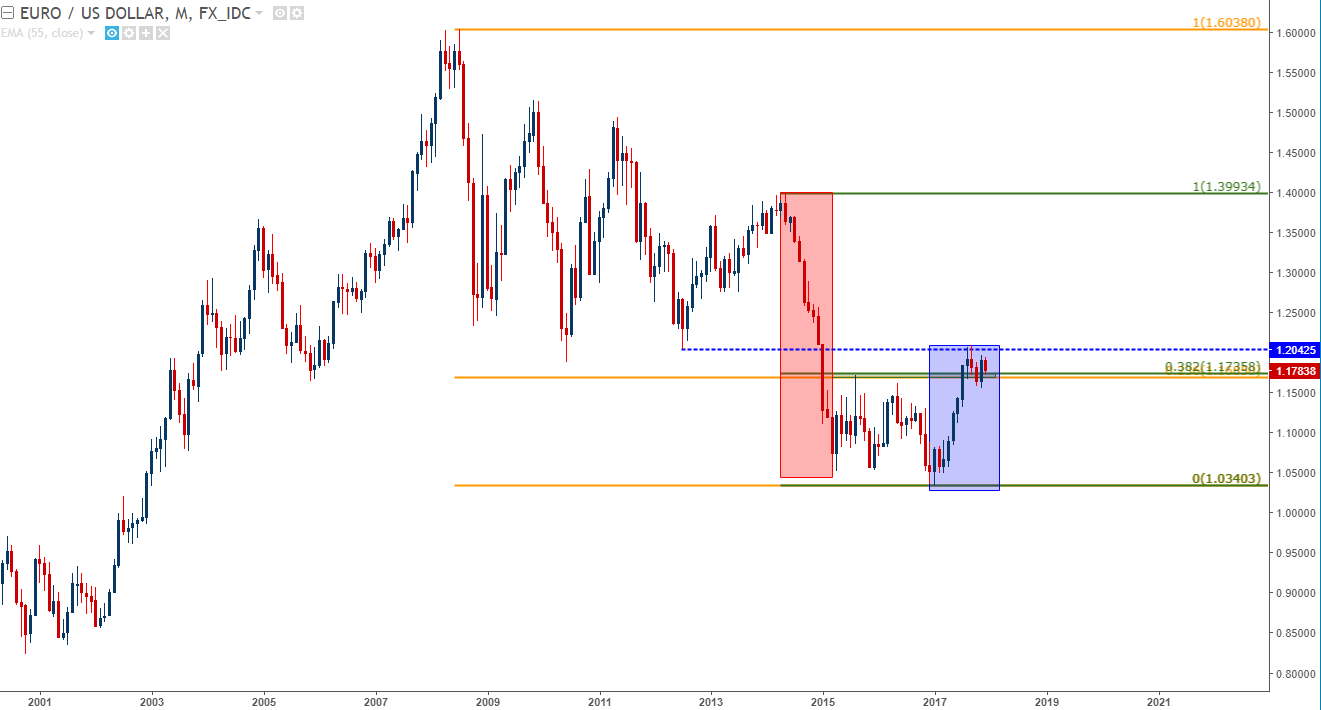
Chart prepared by James Stanley
--- Written by James Stanley, Strategist for DailyFX.com
To receive James Stanley’s analysis directly via email, please SIGN UP HERE
Contact and follow James on Twitter: @JStanleyFX


