


Crude Oil Prices Overview:
- Oil prices exploded higher at the market open on Sunday after a weekend attack on a Saudi Arabian processing facility knocked over 5% of the global oil supply offline.
- The Canadian Dollar initially benefited from the surge in oil prices, but sharply higher energy prices threaten a sudden shock to the global economy, and gains that would otherwise accrue during normal trading conditions among the commodity currencies have been tempered.
- Recent changes in retail trader positioning gives us a stronger USDCAD-bullish contrarian trading bias.
Looking for longer-term forecasts on oil prices? Check out the DailyFX Trading Guides.
For a few days, Brexit and the US-China trade war are out of the collective focus of markets participants. News over the weekend that Abqaiq, Saudi Arabia’s largest oil processing facility, was attacked in a missile strike by thus far unknown drones, has crippled over 5% of the global oil supply.
With an uncertain timeline for bringing Saudi Arabia’s process capabilities back online, and OPEC and Russia refusing to step up production, the threat of a near-term supply imbalance has sent oil prices exploding higher at the start of the week. At the time this note was written, crude oil prices were up by more than 14% from the close on Friday, September 13.
While the Canadian Dollar initially benefited from the surge in oil prices, sharply higher energy prices constitute a sudden shock to the global economy.Gains that would otherwise accrue during normal trading conditions among the commodity currencies have been tempered. Indeed, whereas prior to the weekend’s events G10 currencies’ central banks were seeing their rate cut odds drop steadily, traders now think the odds are rising of more accommodative policy action on a sooner time horizon.
Crude Oil Technical Analysis: Daily Price Chart (September 2018 to September 2019) (Chart 1)
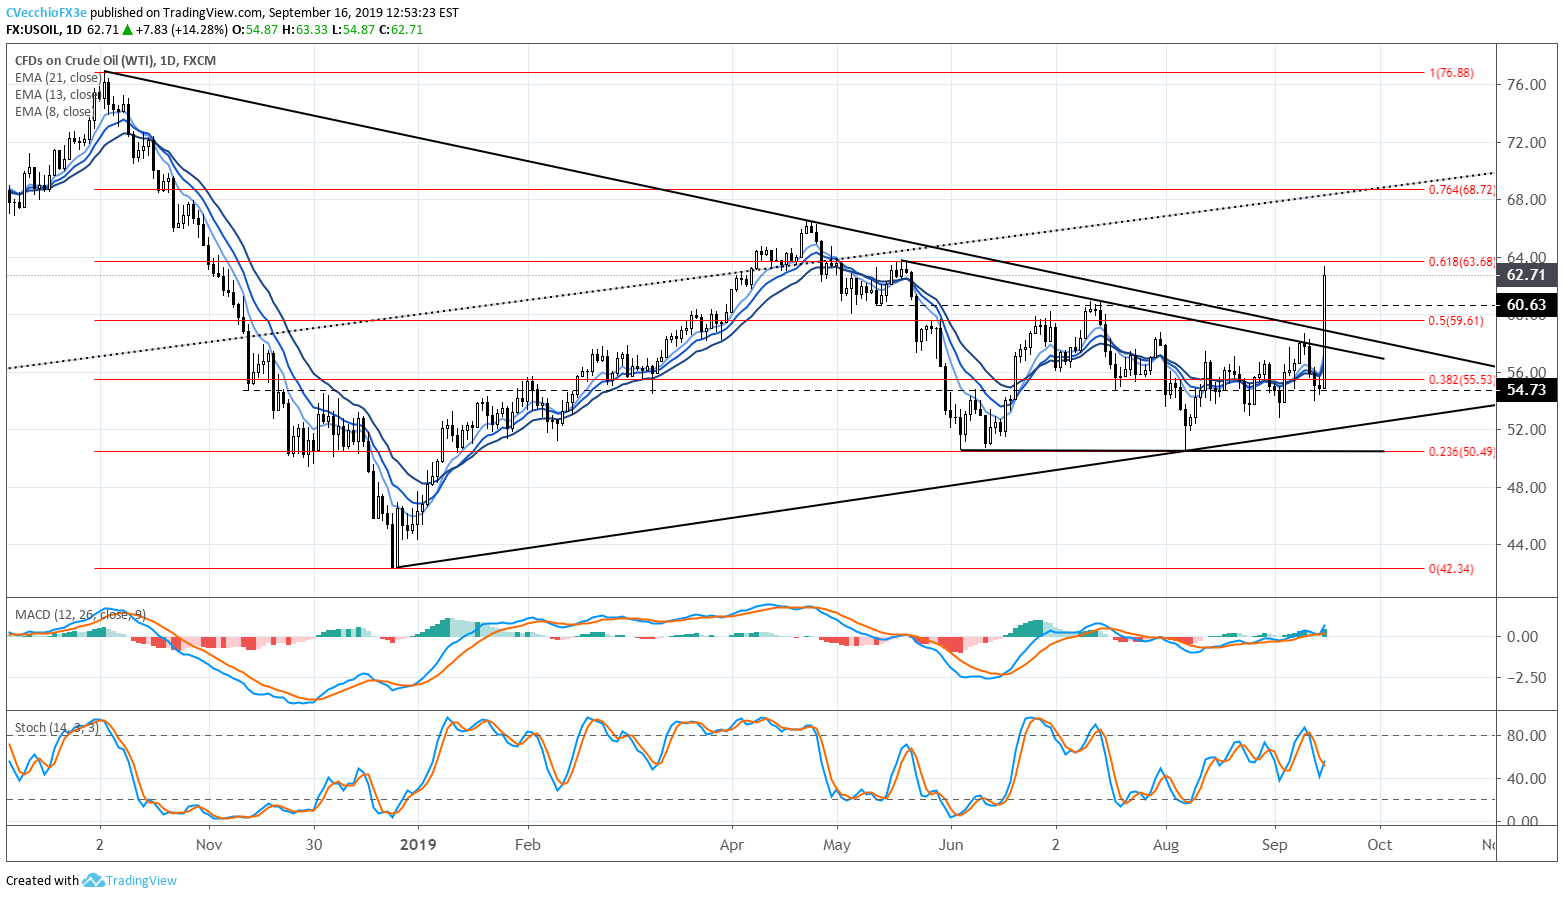
In our last crude oil technical forecast update, it was noted that “prices may be consolidating in a descending triangle since early-May 2019. To this end, there is little clarity on the next move for crude oil prices; traders should be open to both bullish and bearish outcomes.” The bullish outcome is now favored given the gap open higher after the weekend.
Crude oil prices are well-established above their daily 8-, 13-, and 21-EMA envelope, while both daily MACD and Slow Stochastics have turned higher in bullish territory. Now that triangle resistance in the form of the descending trendline from the October 2018 and April 2019 highs has been broke, crude oil prices are eying the 61.8% retracement of the 2018 high/low range at 63.68.
Crude Oil Technical Analysis: Weekly Price Chart (October 2015 to September 2019) (Chart 2)

The break of both the descending triangle in place since the start of May 2019 and the symmetrical triangle in place since the end of September 2018 is apparent on the weekly timeframe. Crude oil prices are firmly above the weekly 8-, 13-, and 21-EMA envelope. Meanwhile, weekly MACD and Slow Stochastics have turned higher; the former is nearing a cross over the signal line into bullish territory, and the latter is already trending higher in bullish territory. Ultimately, a return back to the ascending trendline from the February 2016 and June 2017 lows later this year can’t be ruled out.
IG Client Sentiment Index: Crude Oil Price Forecast (September 16, 2019) (Chart 3)

Crude oil prices: Retail trader data shows 57.4% of traders are net-long with the ratio of traders long to short at 1.35 to 1. The number of traders net-long is 7.4% higher than yesterday and 51.4% higher from last week, while the number of traders net-short is 83.7% higher than yesterday and 0.8% higher from last week.
We typically take a contrarian view to crowd sentiment, and the fact traders are net-long suggests crude oil prices may continue to fall. Positioning is less net-long than yesterday but more net-long from last week. The combination of current sentiment and recent changes gives us a further mixed crude oil price trading bias.
USDCAD Technical Analysis: Daily Rate Chart (September 2018 to August 2019) (Chart 4)
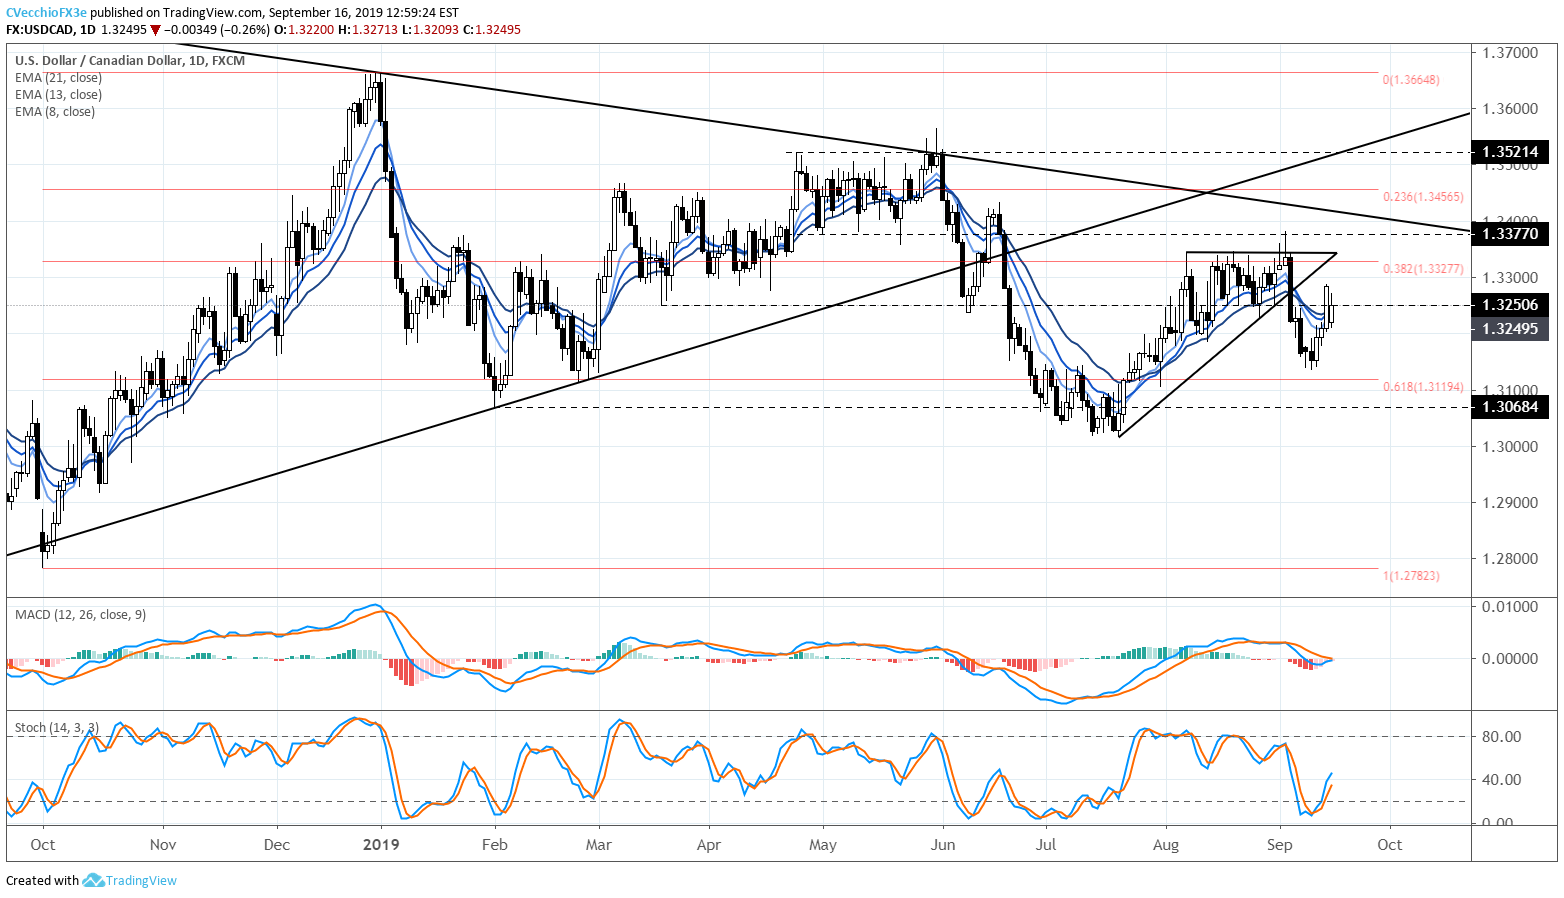
USDCAD rates gapped lower to start the week as the surge in crude oil prices helped triggered correlation program traders. But while a slow, steady rise in oil prices is generally seen as a positive development for the Canadian economy given its approximate 11% dependence on the energy sector, a sudden shock rise in oil prices is not seen as a positive in any regard. If market sentiment shifts back towards concern about a global economic slowdown, the Canadian Dollar will have trouble benefiting from higher oil prices.
For now, USDCAD rates remain above their daily 8-, 13-, and 21-EMA envelope. Daily MACD has arrested its decline and is turning higher at the signal line. Meanwhile, Slow Stochastics have moved up into bullish territory. The path of least resistance is tentatively higher for USDCAD rates; a move back above 1.3300 shouldn’t be ruled out.
IG Client Sentiment Index: USDCAD Rate Forecast (September 16, 2019) (Chart 5)

USDCAD: Retail trader data shows 38.6% of traders are net-long with the ratio of traders short to long at 1.59 to 1. The number of traders net-long is 2.7% lower than yesterday and 20.4% lower from last week, while the number of traders net-short is 13.9% higher than yesterday and 14.1% lower from last week.
We typically take a contrarian view to crowd sentiment, and the fact traders are net-short suggests USDCAD prices may continue to rise. Traders are further net-short than yesterday and last week, and the combination of current sentiment and recent changes gives us a stronger USDCAD-bullish contrarian trading bias.
FX TRADING RESOURCES
Whether you are a new or experienced trader, DailyFX has multiple resources available to help you: an indicator for monitoring trader sentiment; quarterly trading forecasts; analytical and educational webinars held daily; trading guides to help you improve trading performance, and even one for those who are new to FX trading.
--- Written by Christopher Vecchio, CFA, Senior Currency Strategist
To contact Christopher Vecchio, e-mail at cvecchio@dailyfx.com
Follow him on Twitter at @CVecchioFX
View our long-term forecasts with the DailyFX Trading Guides


