


Crude Oil, WTI, Evening Star, Trendline, Technical Briefing - Talking Points:
- WTI crude oil prices fell overnight, reinforcing key resistance
- A Bearish Evening Star could hint at near-term pain ahead
- Further loses places focus on key trendline and support zone

WTI Daily Chart
WTI crude oil prices aimed lower over the past 24 hours, dropping almost 4 percent. That was the worst daily performance in over a week. On the chart below, a bearish Evening Star candlestick pattern appears to have been left behind as prices tested the 113.72 – 116.61 resistance zone. Further downside confirmation could hint at more pain to come.
That would bring crude oil closer towards the rising trendline from December. A breakout lower would still leave the commodity facing the critical 92.95 – 95.11 support zone, however. The latter could step in, maintaining a broader neutral trading bias. Otherwise, clearing under the range of support opens the door to further losses and a bearish technical posture.
On the flip side, crude oil could confirm a breakout above immediate resistance and overturn the Evening Star. This could open the door to further gains and a more bullish outlook. That would expose the current 2022 high, which is part of the 124.76 – 129.41 resistance zone. Now, let us zoom in on the 4-hour chart for more immediate price signals.

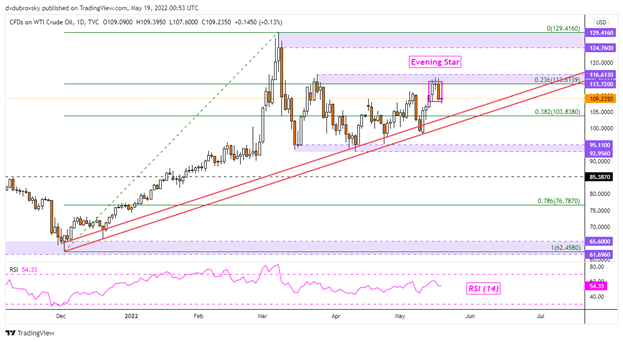
Chart Created Using TradingView
WTI 4-Hour Chart
On the 4-hour setting, WTI crude oil prices confirmed a breakout under the near-term rising trendline from May 10th. That has opened the door to an immediate bearish technical posture, placing the focus on the 108.73 inflection point. Closing under this price subsequently exposes the 104.91 inflection point before the May 10th low comes into focus around 98.49. Confirming a breakout under the latter would then expose the pivotal 92.92 – 95.22 support zone.
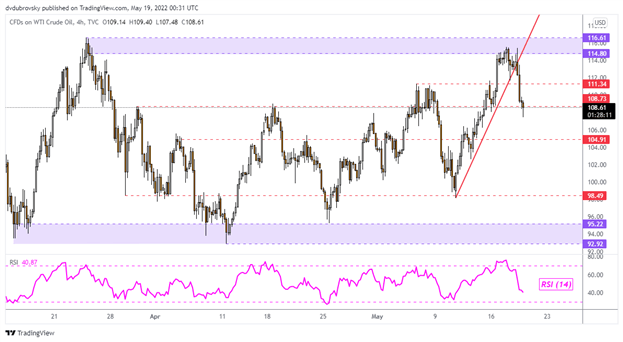
Chart Created Using TradingView
--- Written by Daniel Dubrovsky, Strategist for DailyFX.com
To contact Daniel, use the comments section below or @ddubrovskyFX on Twitter


