


Crude Oil, Colonial Pipeline, EIA inventory, Covid, India, Rising Wedge - Talking Points
- Colonial Pipeline shutdown remains a question mark for crude oil
- Big draw in EIA inventory print reflects US vaccination progress
- Crude oil near the 65 handle within an Ascending Wedge pattern

Crude oil appears to be flatlining so far this week, with prices hovering just below the 65 mark. The lack of volatility in energy prices comes despite a major supply shock. Over the weekend, a major fuel pipeline, running from the Gulf Coast to the Atlantic Northeast, was shut down due to a ransomware attack. That has also forced the US government to declare a state of emergency across many east coast states.
Colonial Pipeline, the company that runs the passage – which carries around 2.5 million barrels of refined fuel product per day—aims to restore operations later this week. However, a big question mark hangs over the timeline, and the longer the pipeline remains shutdown, the larger the impact will be on US energy prices.
The emergency order implemented by the Biden administration loosens restrictions on alternate delivery methods to blunt the shutdown’s impact, but compensating fully for the supply shortfall is not possible with the current infrastructure. The pipeline cyberattack is the second major supply shock to energy markets this year following the Suez Canal blockage. Year-to-date, crude oil prices are up over 30%, with May on track to extend gains from April.
The global economic reopening from the Covid pandemic continues to drive bullish energy into oil markets. As major economies continue to reopen as vaccination rates improve, oil-hungry industries will come back online, bolstering demand – or so that is the prevailing narrative. The situation in India, while not yet making a major impact on global sentiment, is endangering that thesis. In fact, the World Health Organization (WHO) reclassified a Covid variant in India to a “variant of concern.”
That said, energy traders will be closely monitoring the situation in India as the worsening situation’s fallout may start to seep into market sentiment, which would likely present a headwind for oil prices. Alternatively, a bright spot for the Covid picture appeared today when the US Food and Drug Administration (FDA) approved the Pfizer-BioNTech vaccine for use in children aged 12-15. The move by the US regulator is seen as a boon for the country’s vaccination efforts, which is already ahead of most of its peer economies.
The US’s inoculation progress – which now sees near 35% of the total population fully vaccinated, according to the Centers for Disease Control and Prevention (CDC) – has bolstered optimism for a full reopening this summer. In fact, oil demand in the US has already begun to reflect that optimism, with the latest inventory update from the Energy Information Administration (EIA) showing a 7.99 million barrel decline in storage for the week ended April 30 – the biggest draw since January.
The next EIA update is May 12, according to the DailyFX Economic Calendar. It is important to note that the effects of the pipeline’s shutdown won’t be reflected until next week’s EIA release. The result of the shutdown is likely to show a decreased appetite for energy products due to the hampered delivery across the affected states. That said, it may be of particular importance in next week’s release to remark the supply changes within their respective Petroleum Administration for Defense Districts (PADDs).
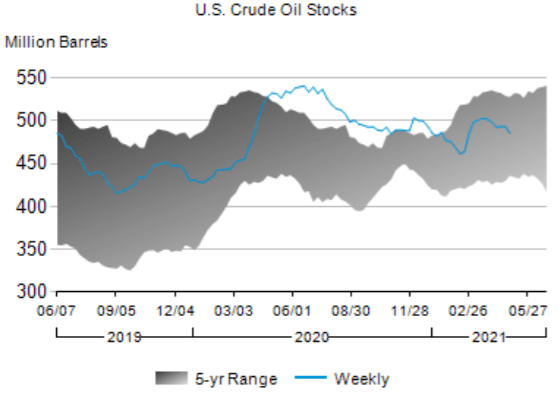
Source: eia.gov
Crude Oil Technical Breakdown
Crude oil has fleshed out a Rising Wedge pattern since early April, although the support line technically requires one more reactionary contact point to validate the pattern. Nonetheless, the price action represents a phase of upward consolidation and may ultimately lead to a reversal against the prevailing upward trend.
Currently, the 9-day Exponential Moving Average (EMA) appears to be underpinning price, a trend seen recently within the wedge pattern. MACD and the Relative Strength Index (RSI) are oriented lower, but the 38.2% Fibonacci retracement appears to be providing an additional layer of support. Alternatively, a move higher may see resistance at the 23.6% Fib level, which nearly coincides with the psychologically important 65 handle.
Crude Oil 8-Hour Chart
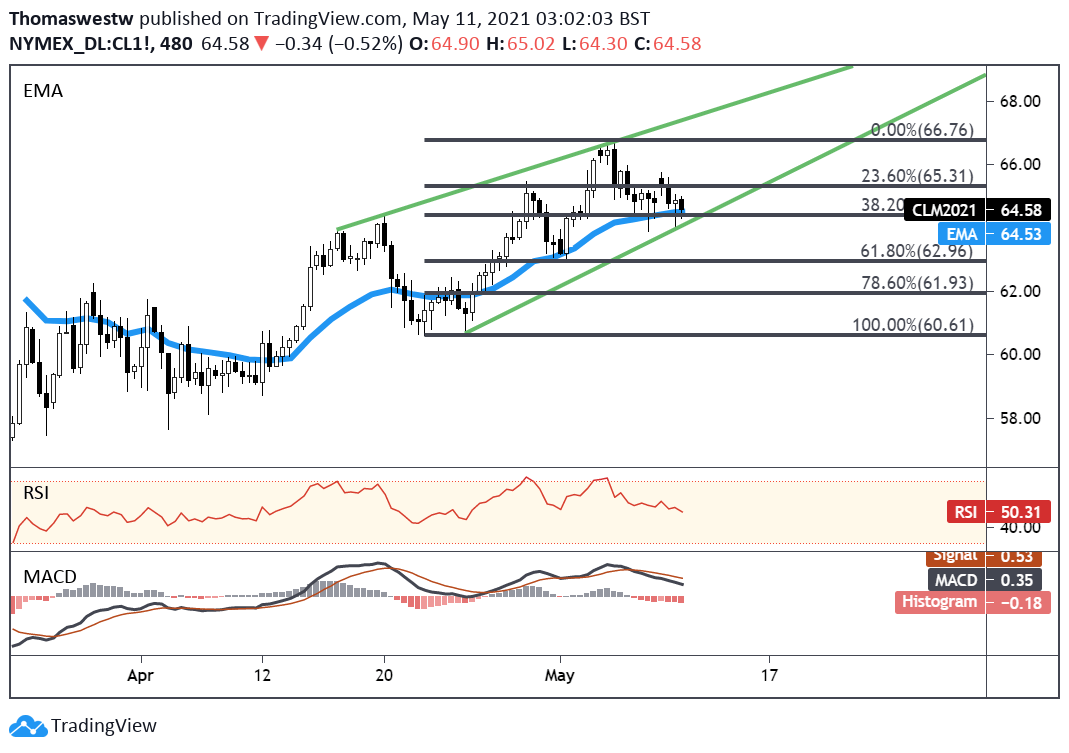
Chart created with TradingView
CRUDE OIL TRADING RESOURCES
- Just getting started? See our beginners’ guide for FX traders
- What is your trading personality? Take our quiz to find out
- Join a free webinar and have your trading questions answered
- Subscribe to the DailyFX Newsletter for weekly market updates
--- Written by Thomas Westwater, Analyst for DailyFX.com
To contact Thomas, use the comments section below or @FxWestwater on Twitter


