


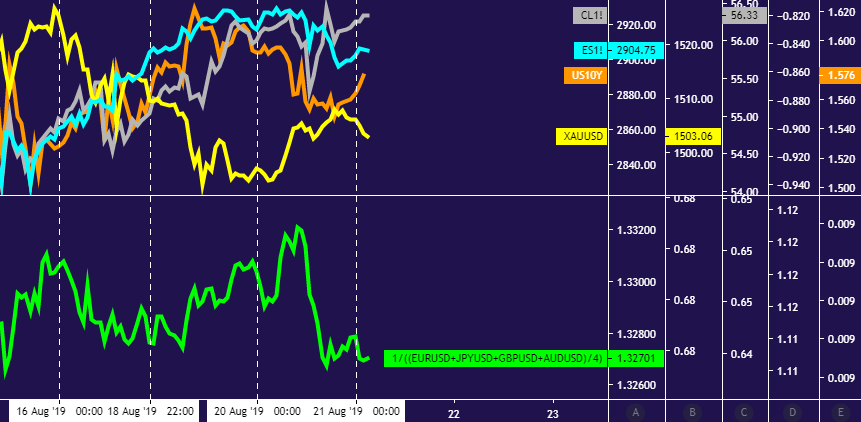
Crude oil, gold price performance chart created using TradingView
GOLD & CRUDE OIL TALKING POINTS:
- Gold prices look to bond yields for direction as FOMC minutes loom
- Negative RSI divergence suggests that gold may be carving out a top
- Crude oil prices at risk if cooling Fed rate cut bets stoke risk aversion
Benchmark commodity prices continued to consolidate as expected Tuesday, mirroring similar dynamics across the broader financial markets. Gold prices edged higher, narrowly trimming losses from the preceding two sessions as bond yields and the US Dollar retraced recent gains.
Crude oil prices drifted lower alongside stocks, but a late-day rebound brought the WTI contract to close essentially flat. Newswires cited API inventory flow data as a possible catalyst. It showed that stockpiles shed 3.45 million barrels last week, topping bets on a 1.33-million-barrel draw expected by analysts.
GOLD PRICES EYE BOND YIELDS AS FOMC MINUTES THREATEN SENTIMENT
The standstill seems to reflect investors’ unwillingness to commit one way or another before key event risk begins to cross the wires. The first of these much-anticipated catalysts now comes into view in the guise of minutes from July’s FOMC monetary policy meeting.
The US central bank issued its first interest rate cut in a decade then but carefully pitched the move as a late-cycle adjustment rather than the start of an easing campaign. The markets are very much expecting the latter in the meanwhile, pricing in 50-75bps in further rate reduction this year.
Commentary that pours cold water on such exuberant prognostications may sour traders’ mood market-wide, sending crude oil lower along with share prices. The likely response from gold prices is a bit more difficult to pin down as bond markets attempt to reconcile conflicting cues.
On one hand, diminished rate cut prospects ought to boost yields. On the other, haven demand for government debt amid risk aversion stands to pressure them lower. Whatever the net result for baseline borrowing costs, the yellow metal will probably deliver a move of similar character in the opposite direction.
Get our free guide to help build confidence in your gold and crude oil trading strategy !
GOLD TECHNICAL ANALYSIS
Gold prices are idling below August’s high at 1535.03, with negative RSI divergence warning of possible topping. Swing low support lines up at 1480.00, with a break below that on a daily closing basis exposing the 1437.70-52.95 area. A push above resistance eyes a weekly chart inflection level at 1563.00 next.
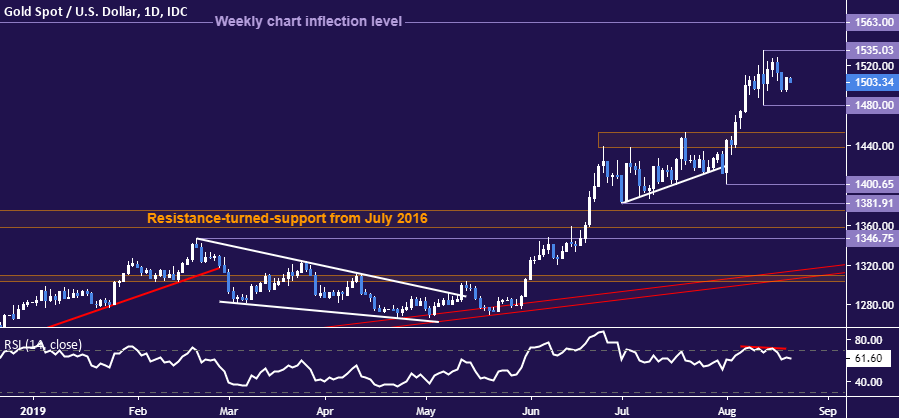
Gold price chart created using TradingView
CRUDE OIL TECHNICAL ANALYSIS
Crude oil prices continue to mark time below resistance guiding the down move since late April, now at 58.26. A daily close above that aims for the 60.04-84 zone next. Alternatively, a turn below congestion area support extending down through 53.95 opens the door to retest the $50/bbl figure anew.
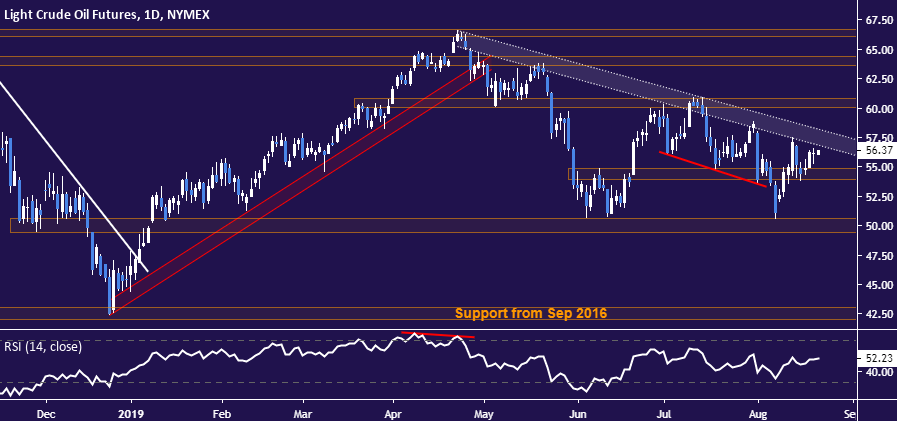
Crude oil price chart created using TradingView
COMMODITY TRADING RESOURCES
- See our guide to learn about the long-term forces driving crude oil prices
- Having trouble with your strategy? Here’s the #1 mistake that traders make
- Join a free webinar and have your commodity market questions answered
--- Written by Ilya Spivak, Currency Strategist for DailyFX.com
To contact Ilya, use the comments section below or @IlyaSpivak on Twitter


