


CRUDE OIL & GOLD TALKING POINTS:
- Crude oil prices rise on hopes for easing of US-China trade war
- Gold prices decline as bond yields recouple with the US Dollar
- US market holiday closure may mute price action in commodities
Crude oil prices roared higher alongside stocks amid a broad-based recovery in risk appetite on Friday. The move seemed to reflect reports of an overture from China meant to de-escalate the trade war with the US. Investors’ rosy disposition translated into a parallel rise in bond yields and the US Dollar as the prospect of resolving a major economic headwind buoyed Fed rate hike bets. Not surprisingly, gold prices fell.
CRUDE OIL MAY STALL, GOLD PRICES EYEING HEADLINE RISK
Looking ahead, crude oil may struggle for directional progress. Trading in futures will be shortened and overall liquidity diminished by the Martin Luther King Jr. Day holidayin the US. Trading in OTC spot markets will continue, so gold may yet respond to headline flow shaping overall sentiment as the US government shutdown and the Brexit drama drag on. What this means in practice is unclear however.
See our guide to learn about the long-term forces driving crude oil prices !
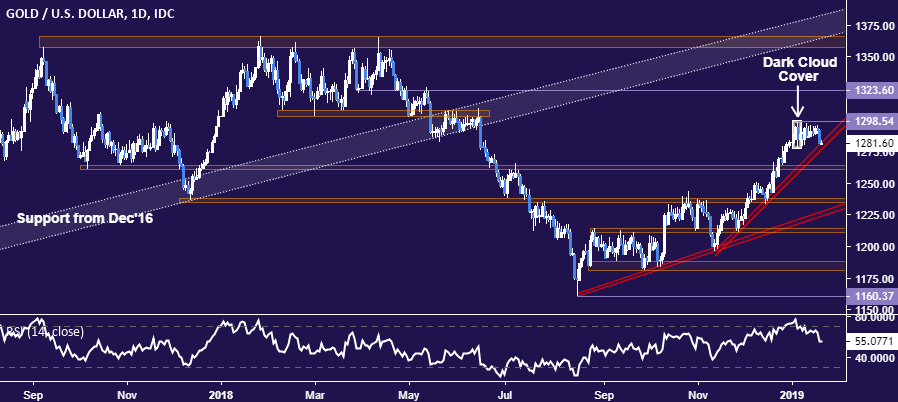
GOLD TECHNICAL ANALYSIS
Gold prices dropped to test support at a rising trend line guiding the move higher since mid-November, suggesting they may yet make good on the bearish Dark Cloud Cover candlestick pattern produced over two weeks ago. A break below this barrier, now at 1278.15, exposes the 1260.80-63.76 zone. Near-term resistance remains at 1298.54, the January 4 high.
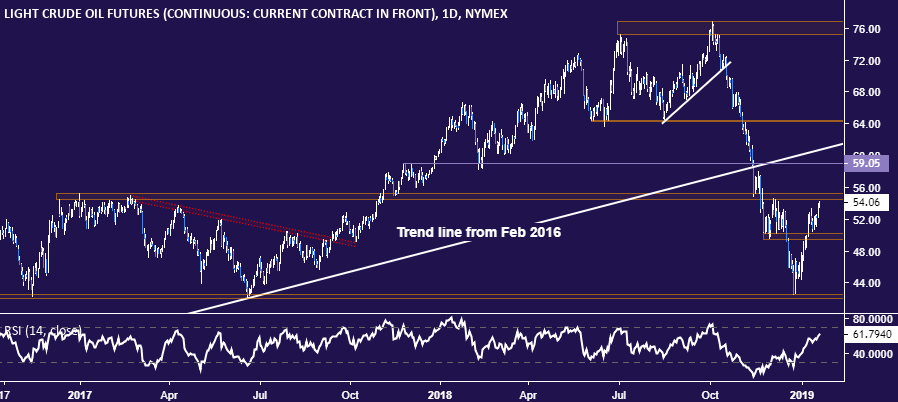
CRUDE OIL TECHNICAL ANALYSIS
Crude oil prices are approaching resistance in the 54.51-55.24 zone, with a daily close above that opening the door for a test of the chart inflection point at 59.05. Support is in the 49.41-50.15 region, with a turn back below that paving the way for another challenge of the 42.05-55 area.
COMMODITY TRADING RESOURCES
- Learn what other traders’ gold buy/sell decisions say about the price trend
- Having trouble with your strategy? Here’s the #1 mistake that traders make
- Join a Trading Q&A webinar to answer your commodity market questions
--- Written by Ilya Spivak, Currency Strategist for DailyFX.com
To contact Ilya, use the comments section below or @IlyaSpivak on Twitter


