


GOLD & CRUDE OIL TALKING POINTS:
- Crude oil prices still range-bound despite supportive news-flow
- Gold prices static as Treasury bond yields, US Dollar diverge
- Oil may fall as gold struggles for direction amid risk aversion
Crude oil prices edged higher amid Venezuela-linked supply concerns as well as news that Saudi Arabia may target the US with sharp export cuts in an attempt to drain North American inventories. Prices were nevertheless confined to the narrow range prevailing over the past three weeks. Gold prices marked time, echoing standstill in Treasury bond yields and the US Dollar.
CRUDE OIL MAY FALL AS GOLD OSCILLATES IN RISK-OFF TRADE
Looking ahead, a lull in top-tier event risk may put sentiment trends at the forefront. That bodes ill for cycle-sensitive crude oil prices as bellwether S&P 500 futures point sharply lower, hinting at a risk-off disposition in the final hours of the trading week. As for gold, it may continue to struggle for direction as Treasury bond yields and the US Dollar diverge.
See our guide to learn about the long-term forces driving crude oil prices !
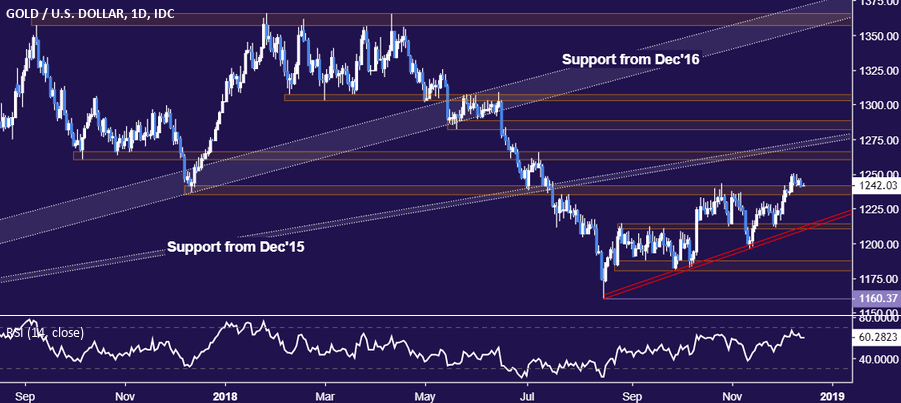
GOLD TECHNICAL ANALYSIS
Gold prices remain glued to resistance-turned-support in the 1235.24-41.64 area. A move higher form here sees the first upside barrier in the 1260.80-66.44 zone, followed by a rising trend line at 1273.81. Alternatively, a reversal back below 1235.24 targets a rising trend line at 1209.88.
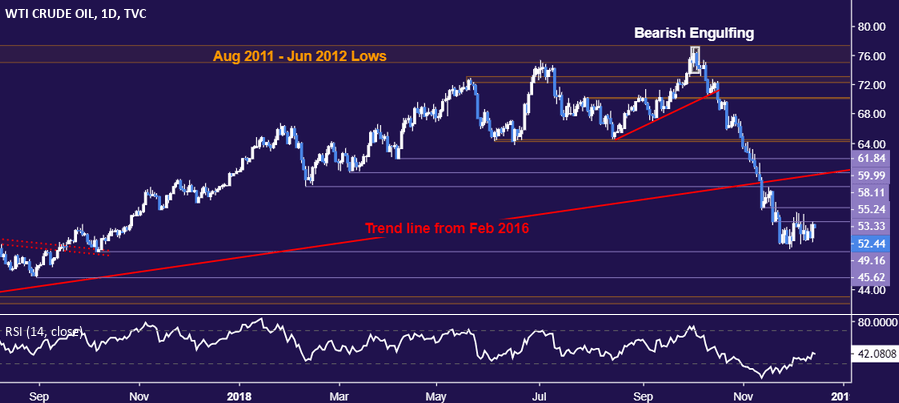
CRUDE OIL TECHNICAL ANALYSIS
Crude oil prices are still stuck in a range below resistance at 53.33 (former support, falling trend line) and support at 49.16, the October 9, 2017 low. A breakdown targets the August 31, 2017 bottom at 45.62. Alternatively, a daily close above the range top exposes support-turned-resistance at 55.24.
COMMODITY TRADING RESOURCES
- Learn what other traders’ gold buy/sell decisions say about the price trend
- Having trouble with your strategy? Here’s the #1 mistake that traders make
- Join a Trading Q&A webinar to answer your commodity market questions
--- Written by Ilya Spivak, Currency Strategist for DailyFX.com
To contact Ilya, use the comments section below or @IlyaSpivak on Twitter


