


Talking Points:
- Gold prices edge down but follow-through unlikely before FOMC
- Crude oil prices recover further but near-term bearish cues remain
- DOE short-term energy outlook, API inventory data now in focus
Gold prices took another leg lower as risk-on trading conditions translated into higher Treasury bond yields, tarnishing the appeal of non-interest-bearing assets epitomized by the yellow metal. Upbeat cues from stock index futures hint at more of the same ahead but significant directional follow-through seems unlikely before the much-anticipated FOMC policy announcement due on Wednesday.
Crude oil prices continued to correct higher. The swell in risk appetite probably helped, with the WTI benchmark tracking the S&P 500 upward. News that flows in the Forties Pipeline System continues to run about a third of capacity (approximately 150k b/d versus about 406k b/d scheduled) despite promises to fix an outage over the weekend may have added to upward pressure.
Looking ahead, the US Department of Energy will release its monthly short-term energy outlook report while API will publish it weekly inventory flow data. The latter result be weighed against expectations of a 3.3 million barrel outflow expected to appear in official EIA statistics due Wednesday, although last week’s performance hints that developments in distilled product storage might dominate attention.
What are the long-term forces shaping crude oil price trends? Find out here !
GOLD TECHNICAL ANALYSIS – Gold prices pushed lower anew following a brief pause, with a close below the 61.8% Fibonacci expansionat 1246.28 exposing the 76.4% level at 1232.16. A further push beyond that targets the 100% Fib at 1209.34. Alternatively, a move back above 1246.28 – now recast as resistance – opens the door for a retest of former support at 1260.80, the October 6 low.
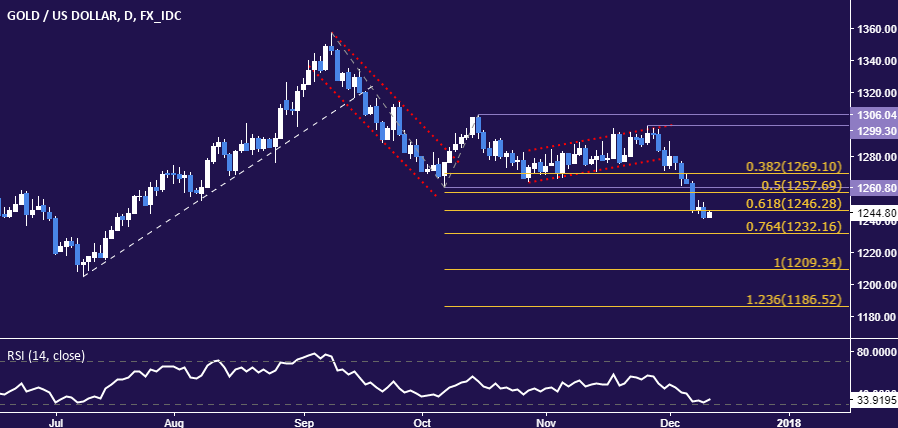
Chart created using TradingView
CRUDE OIL TECHNICAL ANALYSIS – Crude oil prices continue to retrace higher but the break of trend line support set form early October remains valid, as does the series of lower highs and lows set from November 24. On balance, that paints recent gains as corrective. From here, a daily close below 55.04 (38.2% Fibonacci retracement, trend line from late August) exposes the 50% level at 54.08. Alternatively, a push above the 23.6% Fib expansion at 59.83 targets the 38.2% barrier at 62.31.
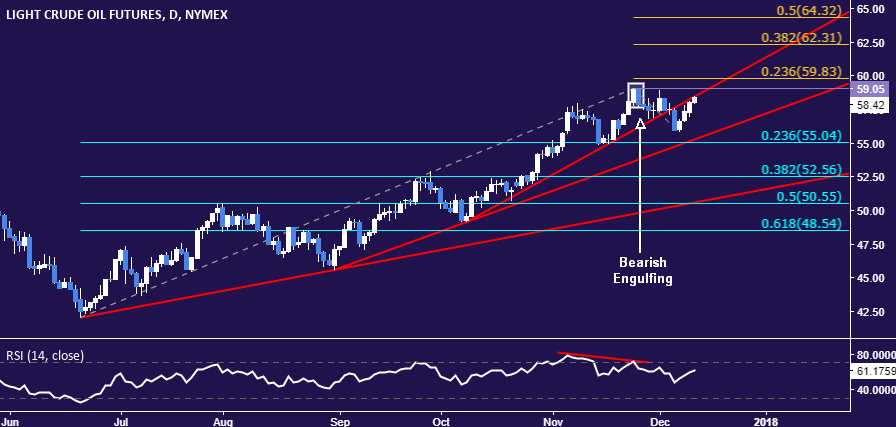
Chart created using TradingView
--- Written by Ilya Spivak, Currency Strategist for DailyFX.com
To receive Ilya's analysis directly via email, please SIGN UP HERE
Contact and follow Ilya on Twitter: @IlyaSpivak


