


Talking Points:
- Gold prices decline as markets shift up Fed rate hike timeline
- Losses may mount in risk-on trade but follow-through suspect
- Crude oil prices sink on build in refined product inventories
Gold prices continued lower as expected, weighed down by an apparent upshift in Fed rate hike timing expectations. The yellow metal fell and the US Dollar traded higher while the spread between 5- and 2-year Treasury bond yields narrowed. Tellingly, this also coincided with a rise in the degree of tightening priced in for the first quarter of next year (as implied in Fed Funds futures).
Looking ahead, a positive lead from S&P 500 futures seems to bode ill for gold as yields rise in risk-on trade, undermining the appeal of non-interest-bearing assets. Sentiment trends have been rather fickle in recent days however, warning against reading too much into such leading cues. News-flow out of Washington DC remains a wildcard as markets balance tax cut prospects with an increasingly ominous Mueller investigation.
Crude oil prices plunged, ignoring EIA data showing US inventories shed 5.61 million barrels last week. That was well in excess of the 2.86 million drawdown expected by investors. The result echoed a private-sector estimate from API released on the prior day. Appropriately enough, it too was ignored. In both cases, a build-up in refined product storage may have explained seemingly counter-intuitive performance.
API said gasoline and distillate stocks added a combined 13.46 million barrels last week. A slightly smaller 8.45 million barrel gain reported in EIA statistics was nonetheless dramatically larger than the expected 2.98 million build. Markets may have reasoned that it is only a matter of time before this kind of dramatic accumulation echoes back up the supply chain, reducing crude demand.
Retail traders expect gold to rise. See here to find out what this hints about on-coming price moves!
GOLD TECHNICAL ANALYSIS – Gold prices are pressuring support in the 1257.69-60.80 area (50% Fibonacci expansion, October 6 low), with a break confirmed on a daily closing basis exposing the 61.8% level at 1246.28. Alternatively, a move back above the 38.2% Fib at 1269.10 opens the door for a retest of channel floor support-turned-resistance at 1282.74.
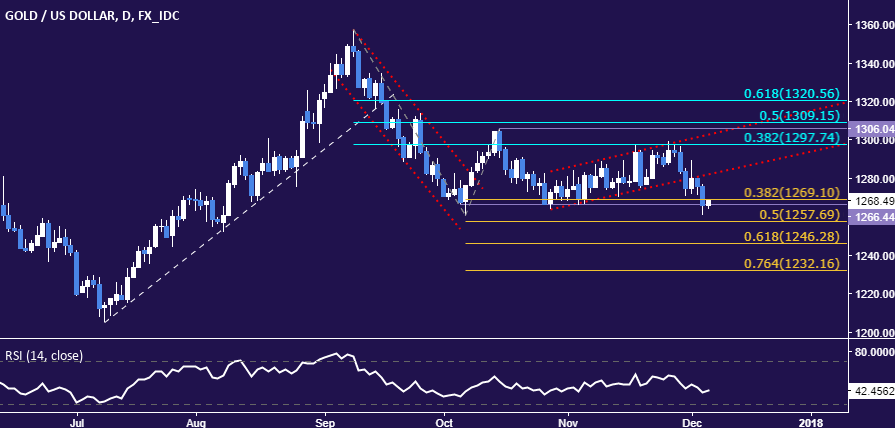
Chart created using TradingView
CRUDE OIL TECHNICAL ANALYSIS – Crude oil prices finally made good on a bearish Dark Cloud Cover candlestick pattern identified last week, convincingly breaking trend line support guiding the advance from early October. Support marked by the 38.2% Fibonacci retracement at 55.25 is now in focus, with a close below that exposing the 50% level at 54.08. Alternatively, a move back above the 23.6% Fib at 56.70 opens the door for a retest of the trend line – now at 58.06 – as resistance.
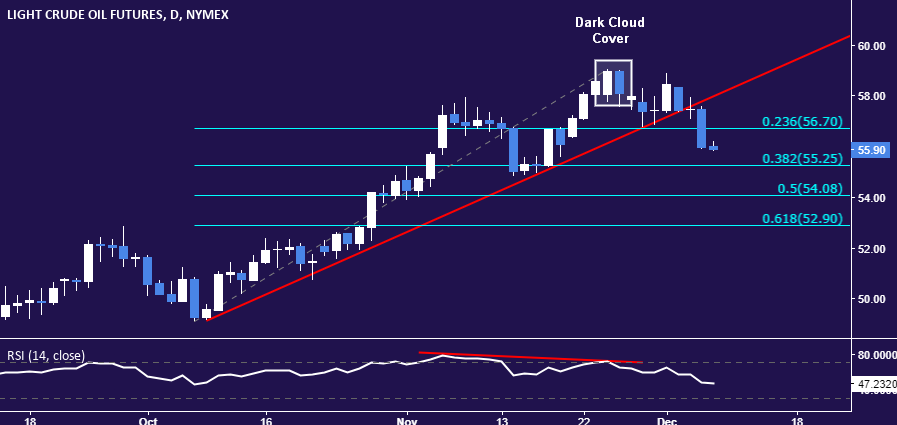
Chart created using TradingView
--- Written by Ilya Spivak, Currency Strategist for DailyFX.com
To receive Ilya's analysis directly via email, please SIGN UP HERE
Contact and follow Ilya on Twitter: @IlyaSpivak


