


Talking Points:
- Crude oil prices may follow stocks lower amid broad-based risk aversion
- Gold prices may advance as souring sentiment weighs against bond yields
- How are our fourth-quarter commodities forecasts faring? Find out here
Crude oil and gold prices found little impetus for trend development over the past 24 hours, languishing within familiar congestion ranges. Top-tier scheduled event risk is notably absent through the week-end, hinting that sentiment trends may emerge as the central driver of performance.
FTSE 100 and S&P 500 futures are pointing lower before London and New York come online, hinting at a risk-off mood. That might boost gold as capital seek haven in Treasury bonds and weighs on yields, boosting the relative appeal of anti-fiat assets. Sentiment-sensitive oil prices may lose ground however.
Retail traders expect gold to rise. Find out here what this hints about actual price trends!
GOLD TECHNICAL ANALYSIS – Gold prices remain wedged within a would-be bearish Triangle chart pattern. A daily close below its lower boundaryand the 38.2% Fibonacci expansion at 1272.01 sees the next downside barrier in the 1260.80-61.50 area (October 6 low, 50% level). Alternatively, a move above Triangle resistance – now at 1293.13– exposes the October 16 high at 1306.04.

Chart created using TradingView
CRUDE OIL TECHNICAL ANALYSIS – Crude oil prices continue to mark time near the 23.6% Fibonacci retracement at 55.01. A daily close below that exposes the 38.2% levelat 53.21. Alternatively, a reversal back above the 14.6% Fib at 56.12 opens the door for a retest of the November 8 high at 57.92.
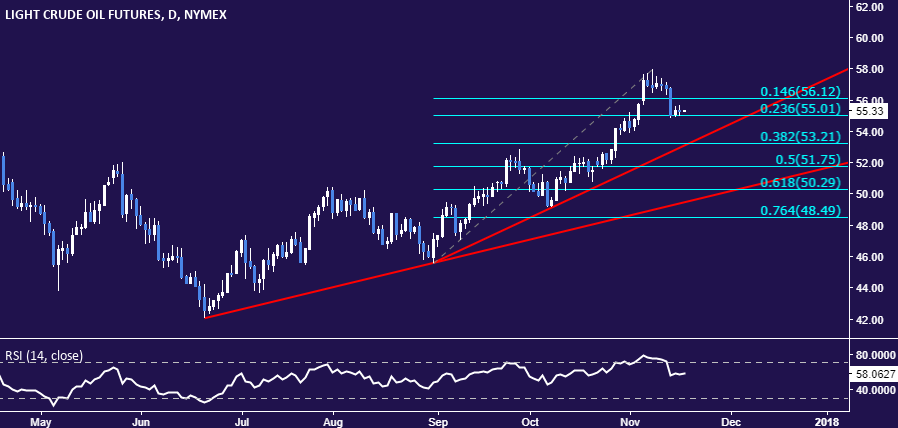
Chart created using TradingView
--- Written by Ilya Spivak, Currency Strategist for DailyFX.com
To receive Ilya's analysis directly via email, please SIGN UP HERE
Contact and follow Ilya on Twitter: @IlyaSpivak


