


Talking Points:
- Crude oil prices track shares lower despite inventory drop
- IEA monthly report, Baker Hughes rig count data on tap
- Gold prices surge as Trump calls US Dollar “too strong”
Crude oil prices turned lower alongside share prices as the cycle-sensitive commodity succumbed to market-wide risk aversion. EIA inventory data showing 2.17 million barrels drained out of stockpiles – a larger draw than the 1.5 million barrel result expected by economists – didn’t seem to register on investors’ radar.
Supply trends may return to the forefront as the IEA monthly report crosses the wires, offering insight on the fragile balance between OPEC’s output cut scheme and surging swing output. On the latter front, the Baker Hughes rig count report showing the number of active US extraction sites will add color.
Gold prices marked time for most of the yesterday’s trading session but a late-day surge courtesy of US President Donald Trump pushed them to the highest level in five months. He told the Wall Street Journal that the US Dollar is “getting too strong”, offering a broad-based lift to USD alternatives.
Practically speaking, the President has few tools besides jawboning to unilaterally force the exchange rate in one direction or another. In fact, the central argument of the so-called “Trump trade” is that his expansionary fiscal program will force the Fed to hike rates faster and boost the greenback.
This means that the benchmark currency’s suffering may not prove lasting. The aggressive down move was likely amplified by thinning liquidity ahead of on-coming Easter market closures, so taking the magnitude of the drop as signaling directional conviction is probably premature.
The US PPI report is expected to show core wholesale inflation hit 1.8 percent on-year in March, the highest since December 2014. That may remind investors that robust price growth will see the Fed continue to tighten regardless of the President’s pronouncements, sending the yellow metal lower.
What will drive crude oil prices through mid-year? See our forecast to find out!
GOLD TECHNICAL ANALYSIS – Gold prices look poised to test above the $1300/oz figure after breaking another layer of chart resistance. A push through the 1302.90-08.00 area (76.4% Fibonacci expansion, former support) exposes the 100% level at 1336.19. Alternatively, a turn back below the 61.8% Fib at 1282.31 paves the way for a retest of the 1263.87-65.66 region (50% expansion, February 27 high).
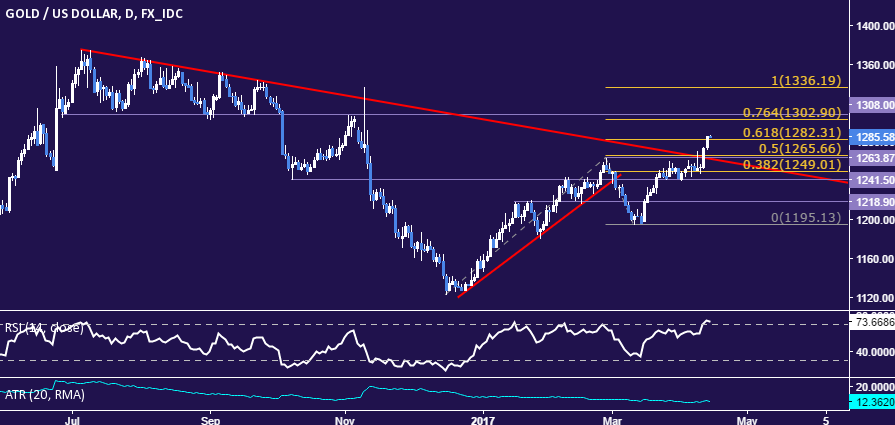
Chart created using TradingView
CRUDE OIL TECHNICAL ANALYSIS – Crude oil prices stalled after touching the highest level in a month, snapping a four-day win streak. From here, a daily close below the 38.2% Fibonacci expansion at 52.04 opens the door for a retest of the 23.6% level at 50.14. Alternatively, a push above the 50% Fibat 53.57 exposes the 55.10-21 area (January 3 high, 61.8% expansion).
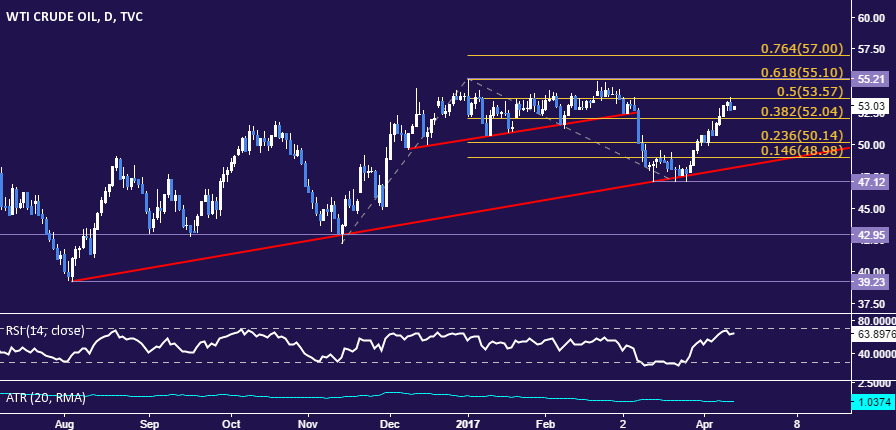
Chart created using TradingView
--- Written by Ilya Spivak, Currency Strategist for DailyFX.com
To receive Ilya's analysis directly via email, please SIGN UP HERE
Contact and follow Ilya on Twitter: @IlyaSpivak


