


Talking Points:
- Gold prices break March swing top, challenge resistance near $1300/oz
- Crude oil prices may reverse downward after signs of indecision emerge
- US employment data headlines a busy week of pivotal event risk ahead
Gold prices enjoyed strong gains in the final 48 hour of last week’s trade, racing out of a consolidation range broadly in play since mid-March. Critically, the move appeared to be triggered by the Bank of Japan monetary policy announcement rather than that of the Federal Reserve.
The metal was little-changed after the US central bank backed away from language highlighting external risks (as we expected) but stopped short of explicitly laying the groundwork for a June rate hike (as it did in November when preparing for post-QE “liftoff” in December). Gold prices jumped only later as US Dollar weakness reverberated across the financial markets from a violent BOJ-inspired drop in USD/JPY.
Japanese financial markets are closed for various holidays for most of this week, which may limit near-term follow-through on last week’s momentum. This may push tertiary catalysts out of the forefront and refocus investors on baseline fundamentals, putting the US Employment report in the spotlight. The outcome ought to be pivotal for rate hike timeline expectations.
Analysts expect a 200k increase in nonfarm payrolls in April – a mild slowdown from the 215k added in March – while the jobless rate holds steady at 5 percent. Equally of note, average hourly earnings are expected to rise at a year-on-year rate of 2.4 percent, making for the first wage inflation increase in four months.
Traders marked down tightening bets after the FOMC signaled an emphasis on domestic matters, with the probability of a June hike falling from 21 to 12 percent. This makes sense: US news-flow has increasingly underperformed relative to consensus forecasts over recent weeks. This may make markets more sensitive to upbeat results that clash with the established narrative versus the alternative.
In this scenario, a reassessment of near-term Fed stimulus withdrawal probabilities could make the US Dollar appear relatively cheap, particularly given the indirect source of last week’s selloff. This bodes ill for gold amid fizzling anti-fiat demand.
For their part, crude oil prices may follow precious metals downward. A firm correlation between the WTI contract and the MSCI World Stock index speaks of sensitivity to risk appetite trends. If US jobs data reboots fears of on-coming tightening, oil may follow equity prices downward.
Where are gold prices going in the second quarter? See our forecast here !
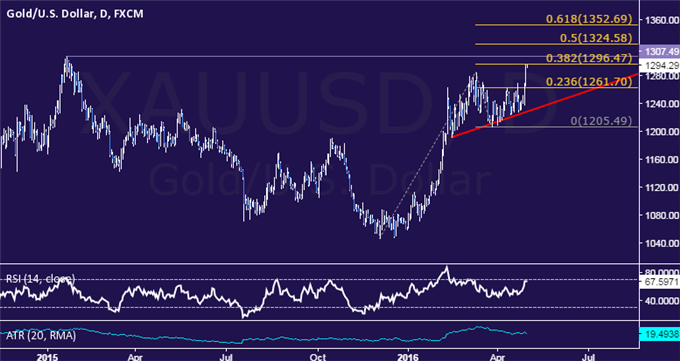
GOLD TECHNICAL ANALYSIS – Gold prices surged above the March swing high, marking the largest daily advance in over a month and hitting the highest level since January 2015. Near-term resistance is now in the 1294.26-1307.49 area, marked by the January 22, 2015 high and the 38.2% Fibonacci expansion. A daily close above this barrier exposes the 50% level at 1324.58. Alternatively, a reversal below the 23.6% Fib at 1261.70 opens the door for a test of rising trend line support at 1226.96.
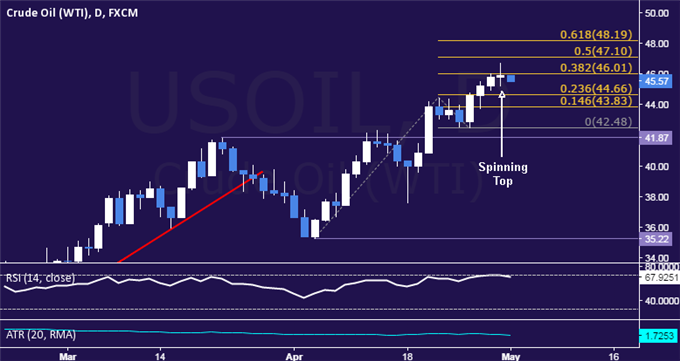
CRUDE OIL TECHNICAL ANALYSIS – Crude oil prices stalled below resistance at 46.01, the 38.2% Fibonacci expansion. A Spinning Top candlestick points to indecision, hinting that upward momentum may be ebbing after the WTI hit a six-month high. This may ultimately prove to have laid the foundation for a reversal lower, although confirmation is decidedly absent for the time being. A move below the 23.6% level at 44.66 exposes the 14.6% Fib at 43.83. Alternatively, a push above resistance targets the 50% expansion at 47.10.
--- Written by Ilya Spivak, Currency Strategist for DailyFX.com
To receive Ilya's analysis directly via email, please SIGN UP HERE
Contact and follow Ilya on Twitter: @IlyaSpivak


